Manufacturing AI: Predictive Quality and Vision‑Powered Automation
Abstract
Quality used to be a department. Now it’s a competitive weapon.
Tolerances are tighter. Product variants keep multiplying. And staffing is unpredictable some weeks you have experienced inspectors, other weeks you’re training people on the fly. In that environment, traditional Statistical Process Control (SPC) still matters, but it’s not enough on its own. SPC is good at catching drift once it shows up in measurements. It’s not built for today’s reality: high-mix lines moving fast, with defects that don’t politely announce themselves in a chart.
That’s why more manufacturers are leaning into AI visual inspection systems for predictive manufacturing quality, AI defect detection, and vision-driven automation. Not because it’s trendy. Because it’s the only practical way to inspect more, faster, and with less variability especially when you’re producing thousands of units a shift and your “final QA sample” is basically a coin toss.
This white paper lays out an end-to-end framework for predictive quality and vision-powered automation. We cover how to combine machine learning (supervised and unsupervised), industrial vision systems, and edge–cloud infrastructure with human-in-the-loop (HITL) operations because fully automated quality is still mostly marketing, and anyone telling you otherwise hasn’t spent time on a line.
You’ll find reference architectures, data pipelines, and model lifecycle guidance for the core tasks that matter in real factories: classification, detection, segmentation, and anomaly detection. The goal isn’t a clever model. It’s reliable AI quality control that survives shift changes, lighting drift, SKU churn, and that one supplier batch that looks “almost the same” until it isn’t.
We also get practical about scaling. Proof-of-concepts are easy to celebrate and even easier to abandon. Scaling requires integration discipline, monitoring, governance, and an operating model that makes the system auditable and maintainable. The paper includes suggested prompts for diagrams and graphs to help teams communicate architectures and workflows clearly useful when you need alignment across IT, OT, Quality, and leadership, not another deck full of buzzwords.
Executive Summary
Business impact (what you can take to the CFO)
Predictive quality reduces scrap and rework, prevents defect escapes, and improves Overall Equipment Effectiveness (OEE). In mature deployments meaning systems that are actually running in production, not sitting in a pilot sandbox it’s realistic to see:
- -20–50% defect reduction
- -5–15% OEE improvement
- -2–5× faster root-cause analysis
Those numbers don’t come from “AI accuracy.” They come from tighter feedback loops. When defects are detected early and linked to process conditions, you stop repeating the same mistakes for days.
Technical approach (what actually works on a production floor)
Use vision models both supervised and unsupervised and combine them with process signals from SCADA/PLC historians to improve overall equipment effectiveness using AI. Feature fusion matters because defects rarely come from “the image alone.” They come from a process drifting quietly: temperature, pressure, cycle time, tool wear, vibration, material lot variation.
Deploy inference on the edge for latency and uptime. Centralize training, evaluation, and governance so you don’t end up with 14 plants running 14 different “versions of truth.”
And here’s a strong opinion: don’t try to replace SPC. Integrate with it. SPC is still valuable. AI is an upgrade layer, not a demolition crew.
Scaling playbook (how you avoid becoming another failed pilot)
Start with one inspection cell where the defect taxonomy is clear and the business value is not debatable. Build a data contract early (what gets captured, how it’s labeled, what metadata travels with it). Instrument labeling workflows and drift monitoring from day one not after the first failure.
Operationalize with MLOps and model risk controls. Then scale in two directions:
-Horizontally
Reuse schemas, operators, model registries, and deployment templates across lines and plants.
-Vertically
Add predictive maintenance signals and prescriptive control once inspection is stable.
Introduction
Manufacturing quality has traditionally been a mix of incoming inspection, in-process checks, SPC charts, and final QA sampling. When defect modes are stable and measurable with a handful of gauges, that model works well. It’s predictable, and it’s been refined for decades. But modern factories aren’t stable environments anymore.
Runs are shorter. Options are endless. Materials vary more than anyone wants to admit. And visual defects the ones customers notice first often don’t show up cleanly in a measurement system. They show up as texture issues, subtle discoloration, micro-scratches, or “something looks off” problems that don’t fit neatly into SPC.
Classic rule-based vision systems helped for a while thresholding, template matching, rigid feature extraction. Then manufacturers started building with composites, reflective metals, textured coatings, flexible packaging. And those systems began failing in predictable ways: they’re brittle, they’re fussy, and they can’t keep up with real-world variation without constant tuning.
AI defect detection for proactive quality control is the natural evolution. It augments SPC with machine learning that flags risk before you’re out of spec, and it adds vision-powered automation so inspection coverage scales to every unit, not just a sample. But the real goal isn’t “catch defects.” That’s the easy part.
The goal is prevention linking defect signals back to process settings and upstream causes so the line stops producing bad parts in the first place. That’s where the money is. That’s also where most teams struggle, because it requires alignment across computer vision, industrial controls, and operating discipline.
This paper brings those pieces together practices from ML, OT systems, and MLOps to help teams build robust, auditable AI quality control systems that don’t collapse after the pilot phase and actually deliver financial outcomes you can defend.
Problem Framing and Requirements
Objectives
- -Defect reduction: lower PPM and escape rates.
- -Cycle time: maintain or improve takt with minimal latency increase.
- -Traceability: link images and decisions to unit serials and process states.
- -Explainability: show bounding boxes, masks, and contributing features.
- -Governance: align with ISO 9001 and IEC 62443 cybersecurity controls.
Constraints
- -Real‑time: edge inference budgets of 10–100 ms per frame; batching limited.
- -Compute envelope: fanless edge PCs/SoMs; power and thermal limits; limited GPU.
- -Data rights: customer IP, export controls; data minimization.
- -Change control: validated golden samples and approval workflows.
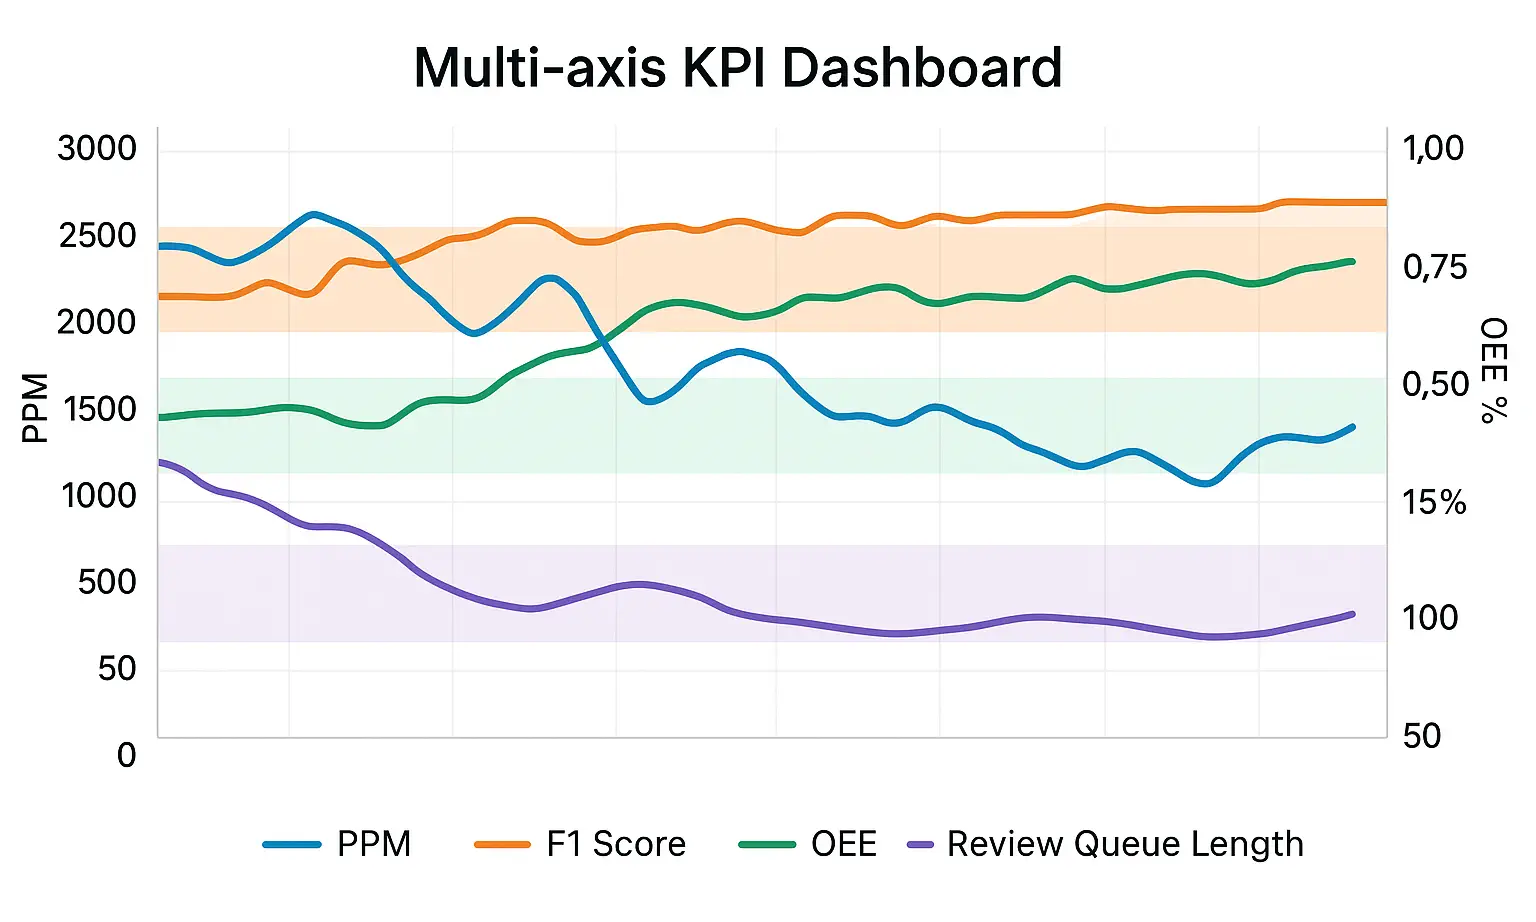
Success Metrics
- -Quality: Precision/Recall, F1, AUROC/AUPRC, mean Average Precision (mAP) for detection, IoU/Dice for segmentation, anomaly detection PRO score.
- -Operations: OEE (Availability × Performance × Quality), FP/FN per lot, review burden, time‑to‑contain.
- -Economics: scrap/rework savings, labor reallocation, NRE amortization, payback period.
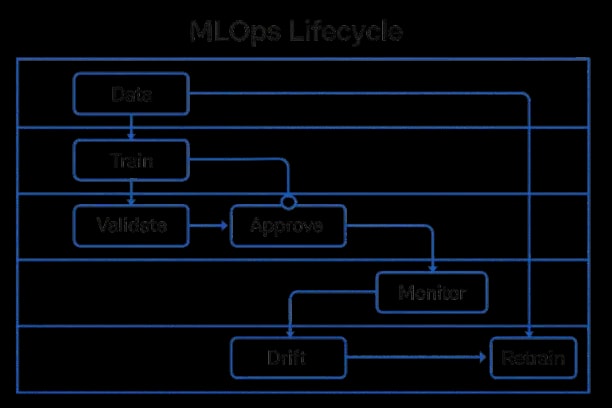
Reference Architecture
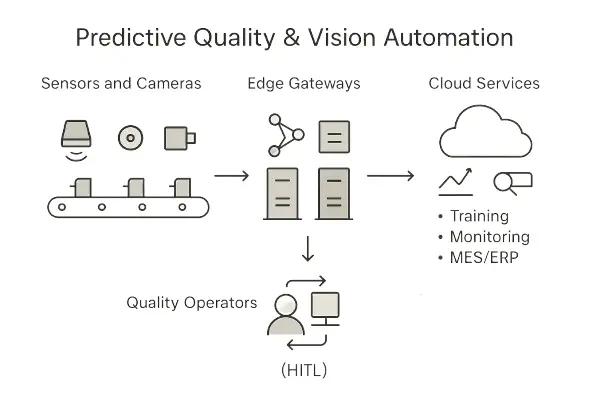
We propose a layered architecture enabling modular evolution and auditability.
Layers
1. Sensing & Actuation: industrial cameras (area/line scan), lighting (ring, bar, dome), encoders, triggers, PLCs, rejectors.
2. Edge Compute: acquisition SDKs, real‑time preprocessing, model servers, rules, safety interlocks; offline cache for store‑and‑forward.
3. Connectivity: deterministic fieldbus to PLCs; MQTT/AMQP to plant network; secure TLS to cloud.
4. Cloud/Datacenter: training pipeline, data lake/feature store, model registry, evaluation farm, monitoring, labeling workbench.
5. Applications: operator UI, quality analytics, SPC integration, alerts, e‑signature approvals, MES/ERP connectors.
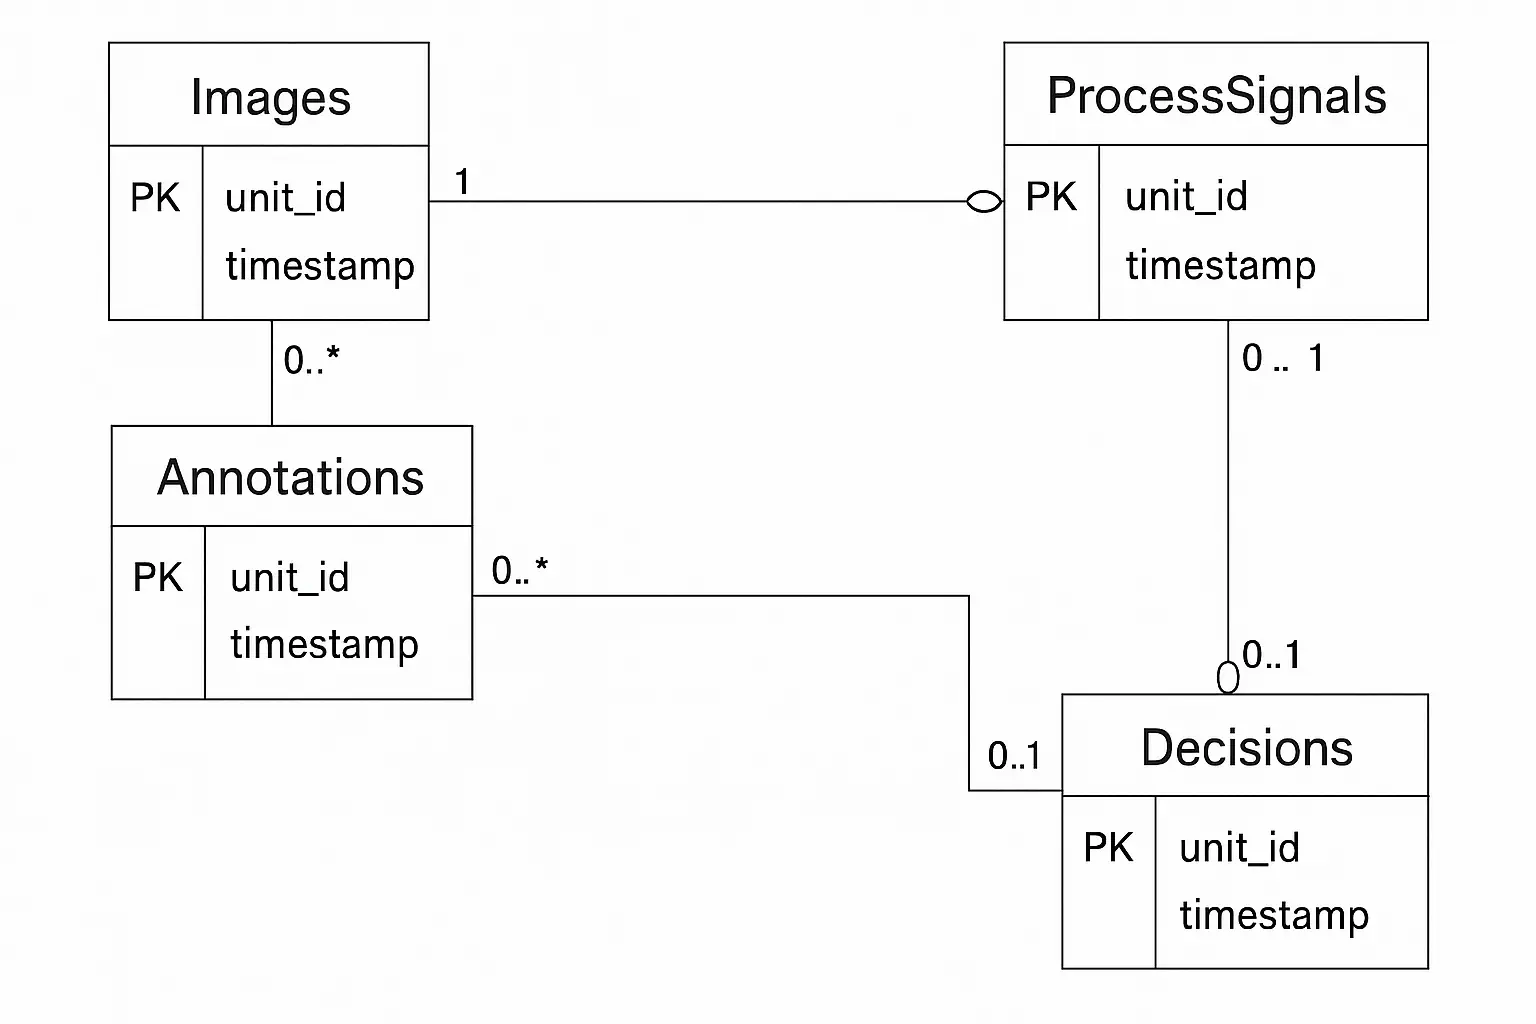
Data Contracts and Schemas
- -Image payload: camera_id, lens, exposure, illumination profile, unit_id, lot_id, timestamp, pose/ROI metadata.
- -Annotation: class, bbox/mask polygons, severity, rationale, reviewer_id, revision.
- -Process features: temperature, pressure, speed, dwell, material codes, tool wear.
- -Decision record: model_id, version, thresholds, confidence, latency, action.
Computer Vision for Quality
Task Types
- -Classification: unit OK/NOK or grade (A/B/C). Baseline for simple surfaces.
- -Object Detection: find discrete defects (scratches, chips). Common: YOLOv5/8, RetinaNet; industrial variants.
- -Instance/semantic Segmentation: pixel‑level boundaries (seal integrity, solder bridges). Models: Mask R‑CNN, U‑Net, DeepLab, transformers (Swin‑UNet).
- -Anomaly Detection: scarce labels; learn normality and flag deviations. Methods: reconstruction (autoencoders), embedding distance (PaDiM, SPADE), student–teacher, patch‑core; modern foundation models for embeddings.
- -OCR and Symbolics: lot codes, date codes, alignment marks; robust to reflections.
Data Strategy
- -Golden set: stratified by variants and lighting; at least 100–500 normal images per SKU for anomaly detection; 50–200 defective per class for supervised tasks.
- -Labeling: hierarchical taxonomy (defect→subtype→severity). Active learning to prioritize ambiguous frames.
- -Synthetic data: domain randomization (lighting, texture, noise), CAD‑based rendering, and copy‑paste for rare defects.
Illumination and Optics
Lighting dominates defect contrast. Use diffuse domes for glossy parts; low‑angle darkfield for scratches; coaxial for flat reflective surfaces; NIR/UV for inks and adhesives. Lens selection sets field of view and pixel resolution; maintain at least 3–5 pixels across minimum defect width.
Model Choices and Trade‑offs
- -Edge constraints: prefer lightweight backbones (MobileNet, YOLO‑N/S) or quantized INT8 models.
- -Robustness: ensemble different inductive biases (detector + anomaly model) with OR/AND logic depending on FP budget.
- -Explainability: saliency maps for classifiers; masks/boxes for spatial tasks.
Thresholding and Calibration
Use temperature scaling or isotonic regression on validation data to calibrate probabilities. Operating thresholds should be SKU‑ and severity‑specific, tuned to minimize cost‑weighted error.
Predictive Quality with Process Signals
Vision surfaces symptoms; process signals reveal causes. Fusing both enables earlier interventions.
Feature Engineering
- -Time‑aligned rollups: last‑k mean/var, EWMA, rate‑of‑change, dwell distributions.
- -Physics‑informed transforms: normalize by line speed, temperature compensation.
- -Categorical encoding for materials and tooling IDs.
Models
- -Tabular learners: gradient boosting (XGBoost/LightGBM), random forests for interpretability.
- -Temporal models: 1D CNNs, TCNs, transformers for longer contexts; VAR for baselines.
- -Multi‑modal fusion: early (feature concatenation) or late (stacking) fusion of vision score and process features.
SPC Integration
Predictive analytics for manufacturing operations feed defect risk into control charts (EWMA/CUSUM). When risk crosses a bound, trigger preemptive adjustments or holds.
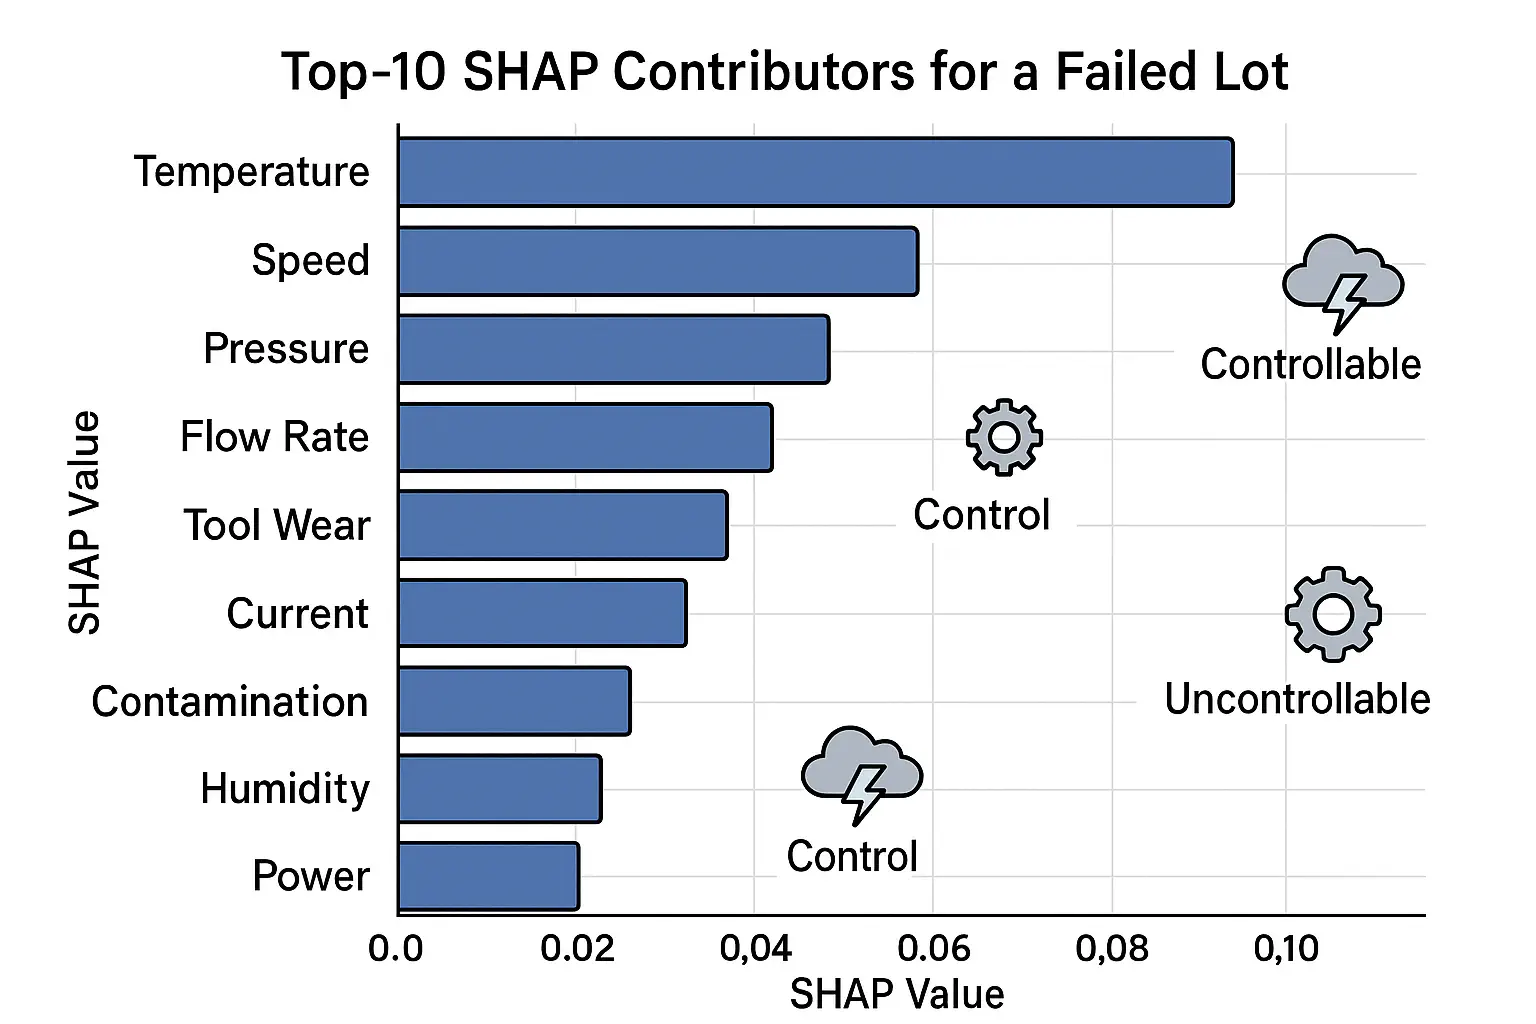
Root‑Cause Analysis (RCA)
Use SHAP values or permutation importance to rank contributing features. Correlate with change logs (tool, material, operator) and maintenance events.
Edge–Cloud Deployment Patterns
Edge Inference
- -Hotpath: camera → preproc → model inference → decision → PLC reject/stop; <100 ms budget.
- -Coldpath: persist frames & telemetry to local cache, batch upload to cloud.
- -High availability: dual‑camera redundancy, watchdogs, and heartbeat monitors.
Model Packaging
- -Containerized models (OCI) with explicit hardware targets (CPU/GPU/NPU). Use a model manifest (name, semver, SHA256, quantization, expected latency, min accuracy).
Orchestration and Updates
- -Rollouts: canary per cell, staged rings per line/plant; rollback on KPI regressions.
- -Policy: signed artifacts, encrypted channels, e‑signature approvals (21 CFR Part 11 where relevant).
MLOps and Quality Governance
Data & Model Lifecycle
- -Data versioning: immutable datasets with provenance; unit/lot lineage.
- -Model registry: versions, metrics, environment constraints, and risk tier.
- -Evaluation: pre‑deployment test suites (per SKU); golden set gates.
- -Monitoring: drift (covariate/label), performance decay, alert fatigue.
Human‑in‑the‑Loop (HITL)
- -Adjudicate borderline cases with triage UI; collect labels and rationales.
- -Use disagreement sampling to surface informative frames.
- -Track reviewer consistency and inter‑rater reliability (κ statistics).
Risk and Compliance
- -Security: IEC 62443 zones/conduits; least‑privilege; signed updates.
- -Privacy/IP: minimize stored imagery; mask proprietary features where possible.
- -Change control: MOC records, approvals, and audit trails; regression plans.
Use Cases and Mini‑Case Studies
1. Surface Defect Inspection on Extruded Aluminum
-Context:
Scratches and die lines on anodized extrusions are costly. Traditional rules failed due to varying glare.
-Approach:
Install diffuse dome lighting; train a two‑stage model-anomaly detector for coarse screening, followed by YOLO detector for defect typing. Fuse with tension and speed signals.
-Results:
Scratches and die lines on anodized extrusions are costly. Traditional rules failed due to varying glare.
2. Solder Joint Inspection in SMT
-Context:
Bridges and insufficient solder lead to costly rework.
-Approach:
High‑resolution area scan; Mask R‑CNN for segmentation; rule‑based geometry checks for lead length and fillet; integrate SPI/AOI signals and reflow profiles.
-Results:
25% fewer escapes, 12% throughput improvement by removing manual second‑pass on clean boards.
3. Bottle Cap Seal Integrity in Beverage
-Context:
Micro‑leaks cause returns; visual cues subtle.
-Approach:
Backlit imaging for silhouette; binary segmentation; anomaly model for unseen leak modes; OCR for date/lot traceability.
-Results:
60% reduction in field returns; comprehensive traceability for recalls.
4. Injection Molding Burn Marks and Short Shots
-Context:
Material lots and barrel temperatures vary.
-Approach:
Thermal cameras plus RGB; multi‑modal fusion with process data (melt temp, injection pressure). Predictive model triggers parameter nudges before defects exceed threshold.
-Results:
30% scrap reduction; stable Cpk > 1.67 on critical dimensions.
Algorithms in Depth
Supervised Detectors and Segmenters
- -Backbones: CSPDarknet, EfficientNet, ConvNeXt, Swin.
- -Training tips: class‑balanced sampling; mosaic/cutmix cautiously; blur/noise augmentations mimic optics; small objects → higher input resolution; focal loss for imbalance.
- -Evaluation: mAP@.5:.95 for detection; IoU/Dice for segmentation; per‑defect confusion matrices by severity.
Anomaly Detection
- -Patch‑based embeddings: compute per‑patch distance to normal distribution; threshold via PRO curves.
- -Reconstruction: autoencoders/generative models; monitor residual maps; beware of over‑smooth reconstructions hiding fine scratches.
- -Student–teacher: train student to match pretrained teacher features on normal data; deviations signal anomalies.
- -Few‑shot: prototype networks for new defect modes.
Multi‑Modal Fusion
- -Early fusion: concatenate vision logits with process features; robust scalers.
- -Late fusion: weighted voting or meta‑learner; tune weights by cost.
- -Causal awareness: avoid leakage by respecting temporal ordering; use rolling windows.
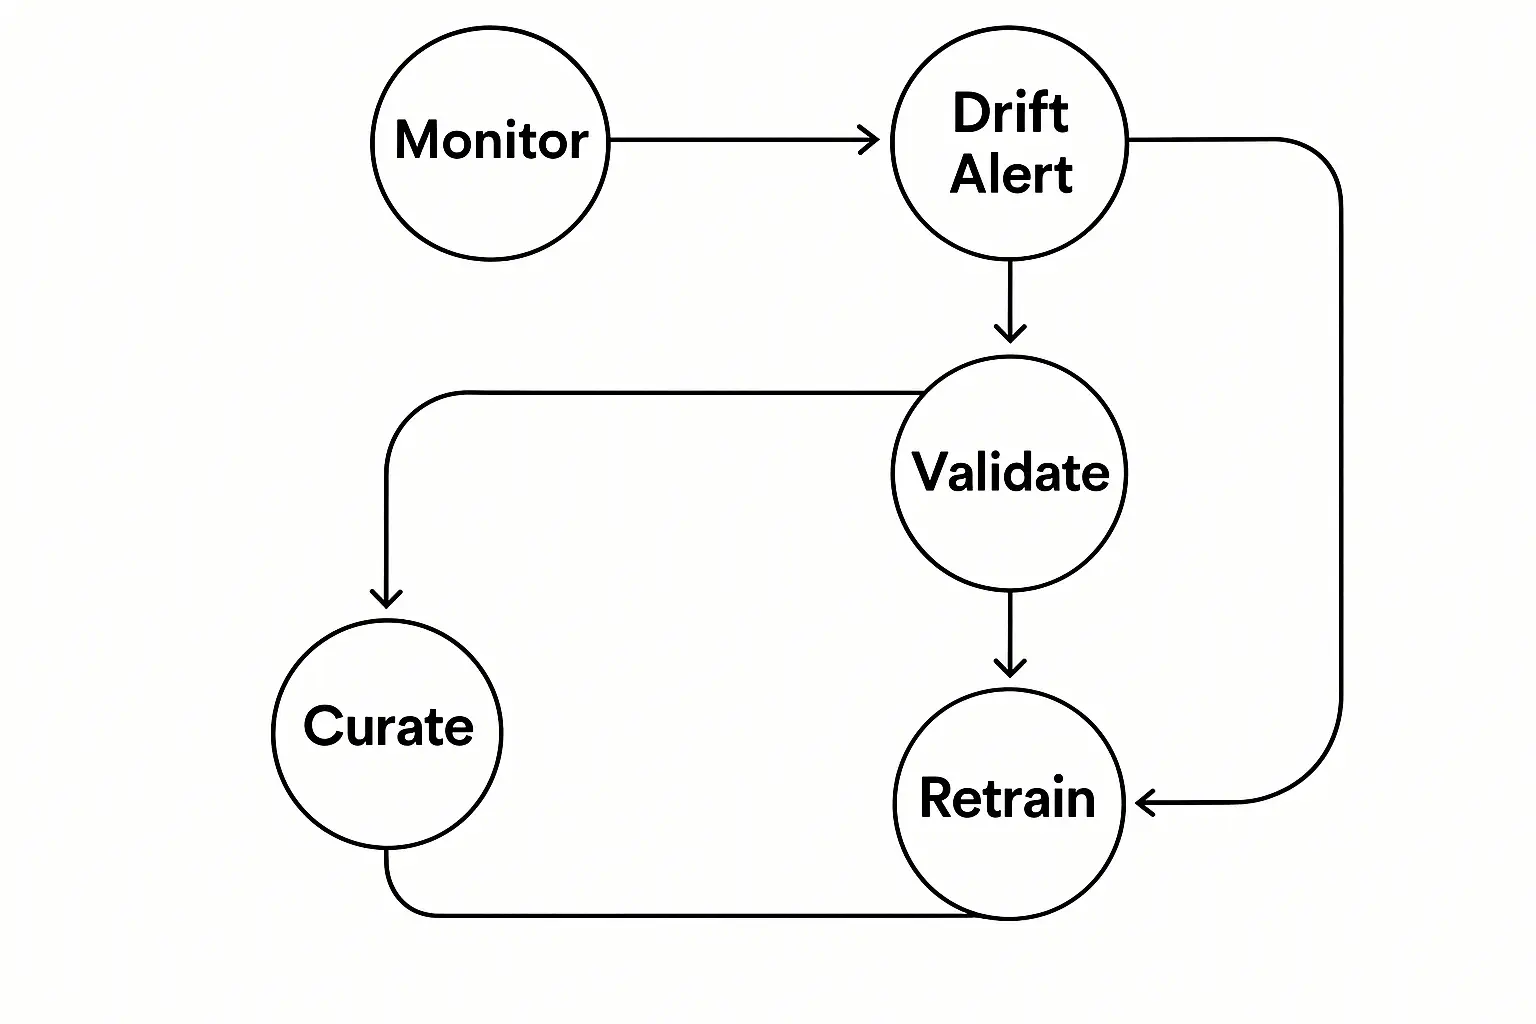
Continual and Active Learning
- -Triggers: drift detectors (K‑S tests on embeddings), operator disagreement, KPI regressions.
- -Pipelines: curate drifted frames → label → retrain on weekly cadence; maintain back‑compat eval.
- -Catastrophic forgetting: replay buffers; regularization (EWC); freeze low‑level layers.
Integrations with Factory Systems
- -PLC/MES: deterministic signaling for reject/stop; lot and serial capture.
- -SPC/QMS: push decisions and features to control charts and CAPA systems.
- -ERP: consumption and scrap posting; supplier quality feedback.
Human Factors and UX
- -Operator UI: clear overlays, zoom, playback, confidence scores, step‑by‑step reasons, and quick adjudication shortcuts.
- -Quality engineer console: threshold tuning, what‑if analysis, SKU/variant configuration, drift charts.
- -Training: short modules on illumination hygiene, lens cleaning, and change control.
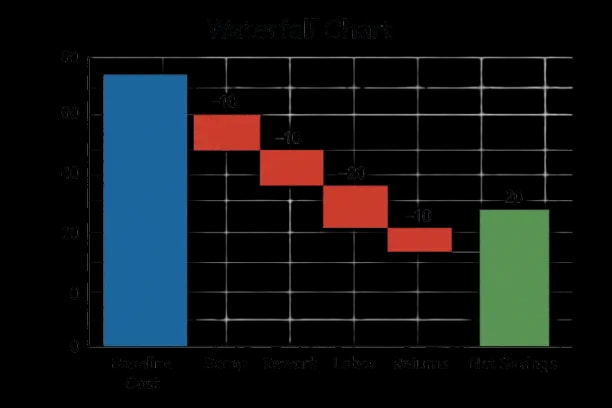
Economics and ROI Modeling
Define a cash‑flow model over 3–5 years including hardware, software, integration, and support; benefits from scrap, rework, labor reallocation, returns avoidance, and capacity gains.
Example: If baseline scrap is 1.5% on a $50M line (COGS basis), each 10% scrap reduction yields $75k/year. AI-driven asset performance management can amplify these savings through predictive maintenance. With expected 30% reduction, benefits ≈ $225k/year. Add $60k/year labor reallocation and $40k/year returns avoidance → $325k/year. If TCO is $180k/year, simple payback < 1 year.
Safety and Cybersecurity
- -Machine safety: AI never bypasses interlocks; reject mechanisms default to safe states.
- -Cybersecurity: asset inventory, signed firmware, network segmentation, zero‑trust access, SBOM for edge software.
- -Resilience: offline operation with local caches; “last‑known‑good” models; watchdog restarts.
Implementation Blueprint
struct FrameMeta {
  unit_id,
  lot_id,
  camera_id,
  ts,
  roi,
  exposure
}

struct Decision {
  model_id,
  version,
  cls,
  score,
  bbox[],
  mask[],
  latency_ms
}

function infer_on_edge(frame, meta):
  roi_frame <- preprocess(frame, meta.roi)
  dets <- detector(roi_frame)
  anom <- anomaly_score(roi_frame)
  fused <- fuse(dets, anom)
  decision <- threshold(fused, sku_specific_params(meta))
  emit_to_plc(decision.action)
  persist(frame, meta, decision)
  return decision

function weekly_retrain(dataset, registry):
  train_split, val_split <- split(dataset, by=[sku, lot])
  model <- train(train_split, augmentations)
  metrics <- evaluate(model, val_split)
  if gates_pass(metrics):
    push_to_registry(model, metrics)
    stage_canary(model)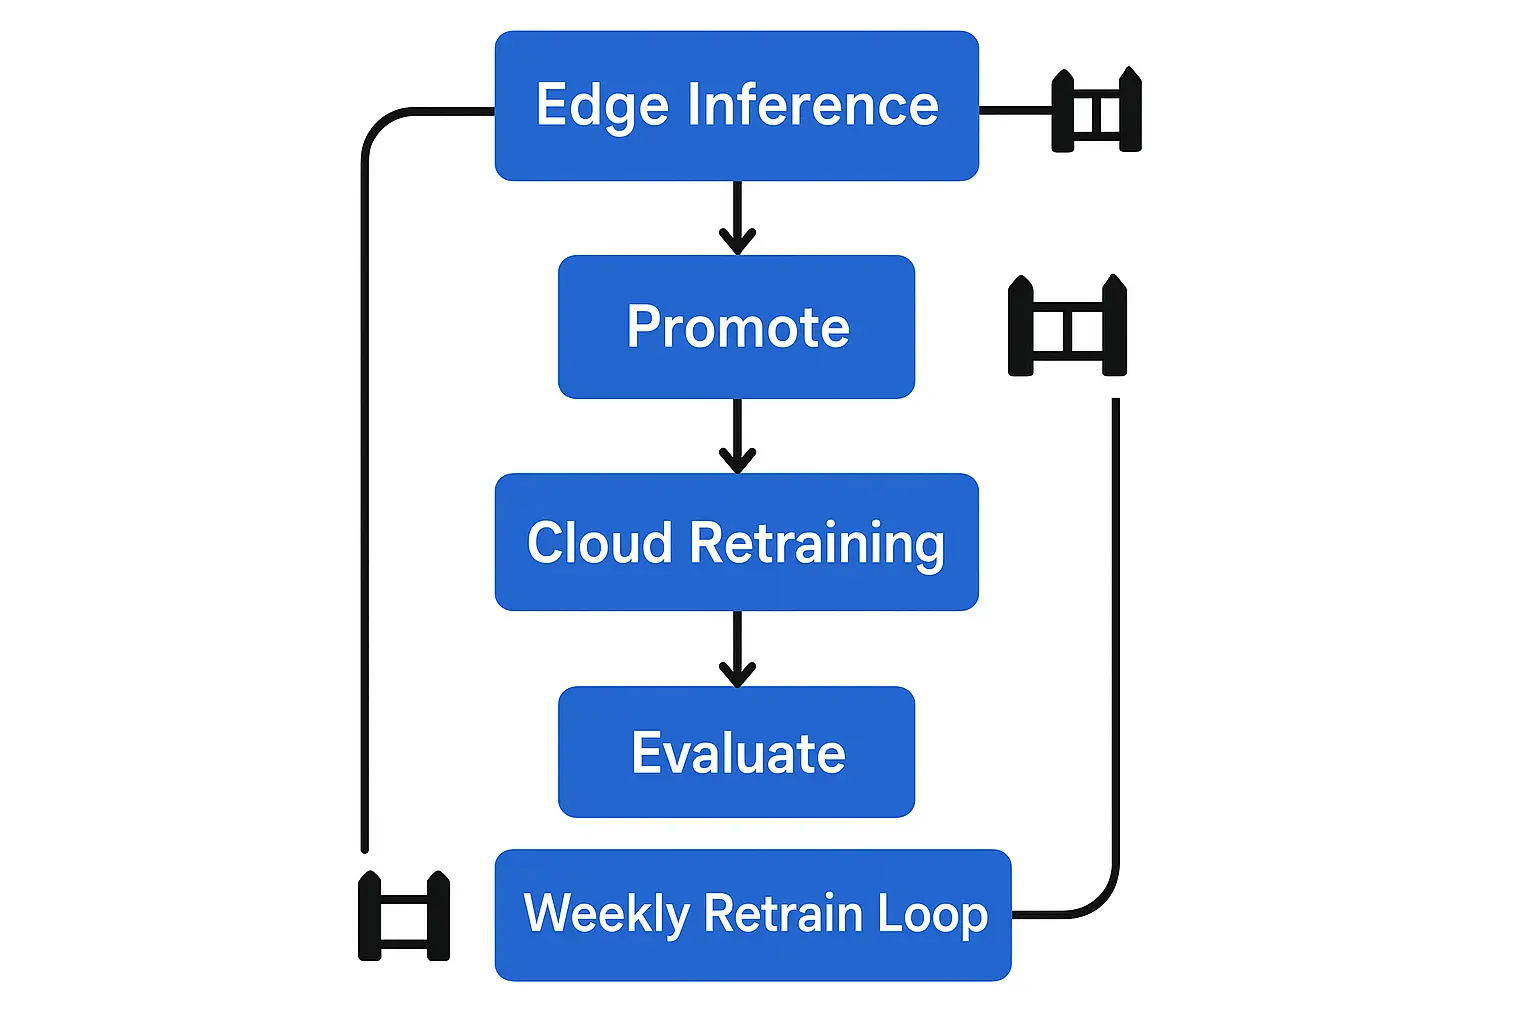
Checklists
Illumination & Optics
- -Define minimum defect size → compute pixel/mm → select lens and working distance.
- -Test three lighting geometries; record F1 vs. lux.
- -Stabilize mounts; add cleanliness SOP.
Data & Labels
- -Draft defect taxonomy with examples per severity.
- -Randomize captures across shifts, lots, and materials.
- -Collect operator rationales for ambiguous calls.
Deployment
- -Define latency and FP/FN SLAs per SKU.
- -Package models with manifests; sign artifacts.
- -Canary by cell, not plant; rollback plan rehearsed.
Monitoring
- -Embed drift detectors; log embedding summaries.
- -Alert on FP spikes and latency p95.
- -Schedule quarterly model risk reviews.
Future Directions
- -Foundation vision models on the edge: distillation and LoRA‑style adapters for SKU specialization.
- -3D/Multispectral: depth, hyperspectral for coatings and contaminants.
- -Self‑supervised pretraining: use unlabelled plant data to boost sample efficiency.
- -Prescriptive control: close the loop with constrained optimizers for set‑point tuning.
- -Multi‑agent cells: planner–critic loops coordinating detectors, OCR, and process predictors with HITL.
Conclusion
Predictive quality and vision‑powered automation can transform production outcomes when treated as socio‑technical systems: optics and lighting tuned to the physics of the part; models matched to compute envelopes; data contracts and governance embedded from day one; and people supported with clear UIs and change management. The practical patterns, blueprints, and prompts in this paper aim to accelerate the path from pilot to scaled, reliable impact.
References
- Montgomery, D. C. (2020). Introduction to statistical quality control. John wiley & sons.[epicopicnic]
- Steven S, S. (2017). The Data Science Design Manual.[hust.edu.vn]
- ISO, G. R. (2015). Quality management systems–requirements. Vol SS-EN ISO, 9001.[sis.se]
- Lesi, V., Jakovljevic, Z., & Pajic, M. (2021). Security analysis for distributed IoT-based industrial automation. IEEE Transactions on Automation Science and Engineering, 19(4), 3093-3108.[ieee]
- Yang, J., Li, S., Wang, Z., & Yang, G. (2019). Real-time tiny part defect detection system in manufacturing using deep learning. IEEe Access, 7, 89278-89291.[ieee]