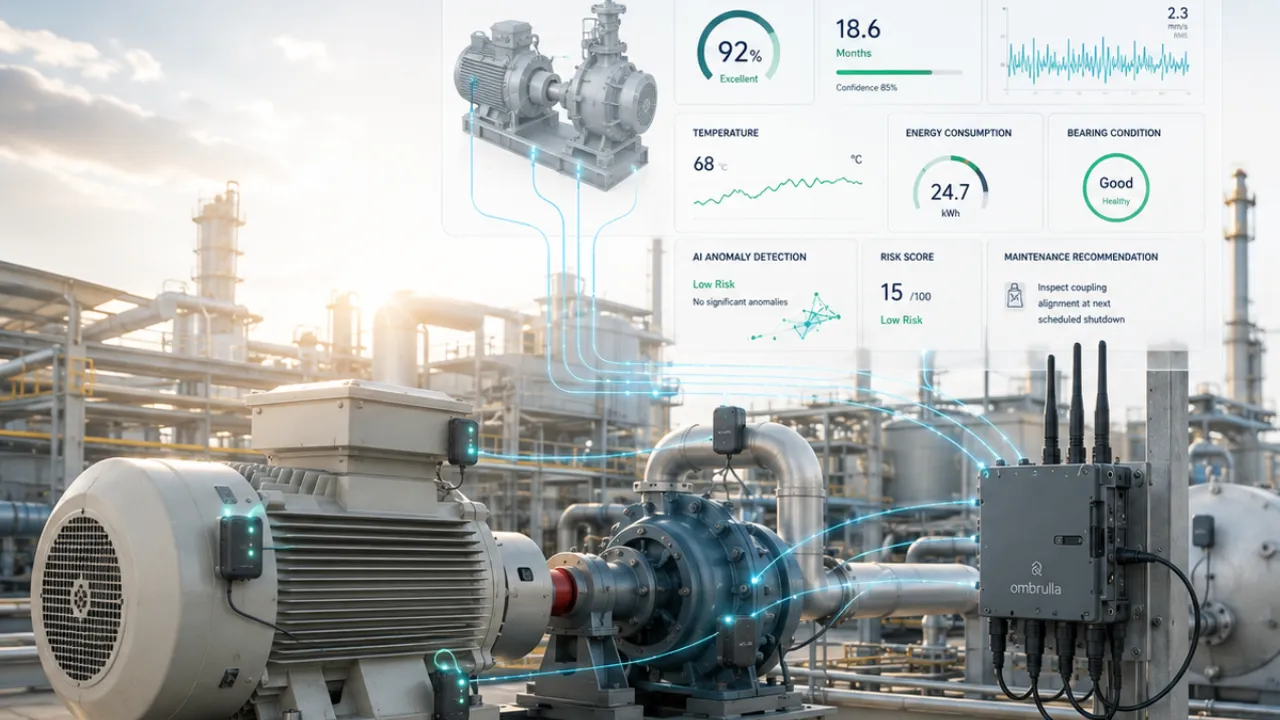
Where AI Meets IoT for Relentless Reliability.

A unified APM concept that fuses IoT sensing, edge intelligence, and cloud AI to predict failures, automate actions, and raise overall equipment effectiveness.

AI + IoT as a Reliability Fabric

Traditional asset performance management focuses on dashboards and alarms. AI + IoT enabled APM turns every asset into a living data source. Sensors stream vibration, temperature, power, pressure, acoustics, and imagery to edge gateways that run rapid anomaly screening. Cloud models learn fleet patterns, estimate Remaining Useful Life (RUL), and recommend actions. PETRAN orchestrates this edge‑to‑cloud loop, so maintenance becomes proactive, evidence‑driven, and scalable.

IoT in Asset Performance Management

IoT in Asset Performance Management

IoT turns every pump, motor, and line into a live signal. With PETRAN, wired and wireless sensors stream vibration, temperature, power, pressure, and vision data to the edge for instant anomaly screening—then up to the cloud for fleet-wide context. The result: real-time visibility, fewer surprises, and right-time interventions that protect throughput and OEE.

Learn More
AI in Asset Performance Management

AI in Asset Performance Management

AI elevates monitoring into foresight. PETRAN's cloud models learn asset and fleet patterns, classify failure modes, and estimate Remaining Useful Life to trigger guided work orders. You get risk-scored, evidence-backed recommendations that cut downtime, reduce maintenance costs, and continuously improve with technician feedback.

Learn More

Business Benefits

Higher Availability & Lower Risk

Reliability‑driven maintenance (RCM/RBI) and predictive maintenance models catch early degradation, preventing costly unplanned downtime.

Icon highlighting reliability-driven and predictive maintenance models that detect early equipment degradation to reduce downtime and risk.

Optimized Maintenance Spend

Shift from time‑based to condition‑based tasks, consolidating work orders and parts usage for measurable cost savings.

Icon showing optimized maintenance spend through condition-based tasks and cost savings.

Quality, Throughput & OEE Gains

Stable assets reduce scrap, micro‑stops, and rework; capacity rises and OEE improves with the same footprint.

Icon representing quality, throughput, and OEE gains from stable, reliable assets.

Assurance & Governance

Evidence‑ready histories, model explainability, and policy compliance aligned to ISO 55000 and ISA/IEC standards.

Icon showing assurance, governance, and compliance aligned with ISO 55000 and ISA/IEC standards.

Core Pillars of the AI + IoT APM Architecture

Icon showing unified, protocol-agnostic sensing across diverse industrial signals and data sources.

Unified, Protocol-Agnostic Sensing

Normalize vibration, acoustics, thermal, electrical, pressure/flow, oil quality, speed/load, vision, and environmental data across OPC-UA, Modbus/TCP, MQTT, and REST—so every asset becomes a reliable signal source.

Icon of Intelligent edge system performing on-device analysis and anomaly detection for instant, reliable alerts.

Intelligent Edge for Instant Triage

Perform on-device feature extraction (enveloping, kurtosis, harmonics), no-motion/shock detection, and first-line anomaly flags at the gateway to deliver sub-second alerts—even during cloud outages.

Icon of Cloud-scale AI analyzing fleet data to detect degradation, predict failures, and forecast remaining useful life.

Cloud-Scale AI for Degradation & RUL

Use fleet-level models to detect subtle performance drift, classify common failure modes, and forecast Remaining Useful Life to move maintenance from reactive to predictive.

Icon of Digital twins capturing real-time operational context to improve diagnostics and maintenance prioritization.

Digital Twins with Operational Context

Maintain a living model of each asset—including duty cycles, setpoints, process states, and work history—to sharpen diagnostics, reduce false positives, and prioritize what matters.

Icon of Closed-loop workflows connecting AI-driven alerts to EAM and CMMS for automated, feedback-enhanced maintenance.

Closed-Loop Workflows into EAM/CMMS

Turn risk-scored alerts into guided work orders with recommended tasks, tools, and parts. Technician feedback flows back to improve models and standard operating procedures.

Icon of Maintenance prioritization based on risk, criticality, and remaining useful life to maximize availability and OEE.

Risk & RUL-Driven Prioritization

Sequence interventions by risk, criticality, and RUL windows rather than calendars. Align labor, spares, and planned downtime to maximize availability and OEE.

Icon of MLOps framework ensures governance, version tracking, security controls, and safe model deployment across environments.

MLOps, Governance, and Security by Design

Track versions, monitor drift, and roll back safely. Enforce RBAC/SSO, audit trails, and encryption in transit/at rest. Deploy in cloud, on-prem, or private VPC with the same controls.

Icon of Open, composable integrations connecting industrial systems and data platforms through APIs for seamless analytics and automation.

Open, Composable Integrations

Connect to historians, PLC/DCS systems, IoT platforms, and data lakes via open APIs. Keep data where it lives while enabling custom analytics, dashboards, and automation with minimal friction.

KPIs & Reporting - turning condition data into decisions.

PETRAN translates raw IoT signals and AI insights into a concise set of KPIs that operators, reliability engineers, and executives can act on immediately. From Asset Health and Alarm Precision to RUL, OEE impact, and maintenance economics, every metric is traceable back to the evidence—sensor features, events, and work history—so you can see why performance is trending and what to do next. Dashboards update in real time, reports schedule automatically, and drill-downs link directly to guided work orders, closing the loop between insight and outcome.

Asset Health Index (AHI)

Track a single, normalized score per asset that blends vibration, thermal, electrical, and process context. Trend AHI over time, set target bands by criticality, and drill down to the root features driving degradation.

Asset Health Index (AHI) measures asset condition using vibration, thermal, electrical, and process data.

Alarm Precision & Signal Quality

Measure true positives vs. noise to keep operators focused. Report precision/recall, time-to-detect, and alert confidence; flag sensors or models that need recalibration to sustain high signal-to-noise.

Monitor alarm precision and signal quality to ensure accurate alerts and reduce noise.

Mean Time Between Failure (MTBF)

Quantify reliability across lines, sites, and asset classes. Slice MTBF by operating mode, workload, and environment to identify where design changes or preventive tasks will yield the biggest reliability lift.

Measure MTBF across assets to identify reliability trends and improve performance.

Mean Time To Repair (MTTR)

Expose delays from first alert to restoration. Break MTTR into diagnosis, parts wait, and execution time; surface bottlenecks and standardize fixes with guided procedures to accelerate recovery.

Analyze MTTR to pinpoint delays and standardize repair processes for faster recovery.

Predicted Risk & RUL Windows

See risk-scored failure probabilities with Remaining Useful Life ranges and confidence intervals. Prioritize interventions by risk and window width, and simulate the impact of deferring or advancing work.

Visualize predicted failure risks and Remaining Useful Life to prioritize maintenance actions.

OEE Impact (Availability • Performance • Quality)

Tie condition insights to production outcomes. Attribute OEE losses to specific assets and failure modes, and verify improvements as predictive tasks reduce unplanned downtime and micro-stops.

Link asset condition insights to OEE metrics to reduce downtime and improve production efficiency.

Maintenance Cost per Unit Output

Track maintenance spend normalized by throughput (₹/unit, $/ton, $/MWh). Compare planned vs. unplanned cost, labor vs. parts mix, and demonstrate ROI as predictive actions shift costs from reactive to planned.

Track maintenance cost per unit to compare planned and unplanned expenses and improve ROI.

Work Compliance & Feedback Quality

Monitor completion rates, SLA adherence, and the usefulness of technician feedback. Score work orders on evidence quality (photos, vibration captures, notes) and loop the best inputs back into model retraining and SOPs.

Monitor work compliance and feedback quality to enhance model retraining and maintenance accuracy.

Hardware & Connectivity - Enterprise-Grade, Field-Ready

An end-to-end sensor and communications stack engineered for premium APM applications: deterministic data capture at the edge, robust telemetry over constrained links, and secure ingestion for real-time analytics and model feedback—without naming or depending on any single vendor.

Icon showing unified, protocol-agnostic sensing across diverse industrial signals and data sources.

Wireless Vibration Nodes (BLE / LoRaWAN / LTE-M)

Tri-axial MEMS/IEPE sampling (up to kHz rates) with on-node FFT/enveloping, configurable duty cycles, hardware time-sync (±1–5 ms), and edge compression. IP66/67, intrinsic-safe variants. Secure provisioning and OTA firmware.

Icon of Intelligent edge system performing on-device analysis and anomaly detection for instant, reliable alerts.

Thermal / Infrared Sensing

Radiometric IR arrays or single-point pyrometers with emissivity correction, spot-size calibration, and region-of-interest alarms. Supports periodic snapshots and delta-T analytics for electrical panels and rotating elements.

Icon of Cloud-scale AI analyzing fleet data to detect degradation, predict failures, and forecast remaining useful life.

Power-Quality Instrumentation

Class A PQ meters capturing V/I RMS, THD, harmonics, flicker, phase imbalance, inrush, and transient events with sub-cycle resolution. Synchronized timestamps for correlation with mechanical anomalies and trips.

Icon showing unified, protocol-agnostic sensing across diverse industrial signals and data sources.

Pressure / Flow Instrumentation

Smart transmitters (HART/Modbus) providing absolute/differential pressure, flow (DP, vortex, mag), and derived cavitation/clog indices. Includes temperature/viscosity compensation and diagnostic status bits.

Icon highlighting reliability-driven and predictive maintenance models that detect early equipment degradation to reduce downtime and risk.

Oil Condition & Tribology Sensors

Inline viscosity, dielectric constant, moisture (ppm), ferrous particle counts, and ISO code estimations. Edge fusion with vibration bands for bearing/gear mesh degradation scoring.

Icon of Open, composable integrations connecting industrial systems and data platforms through APIs for seamless analytics and automation.

Industrial Edge Gateways

Multi-protocol I/O (OPC-UA, Modbus/TCP, Ethernet/IP, MQTT), hardware TPM, and containerized ML runtimes. On-device feature extraction, anomaly scoring, store-and-forward with back-pressure handling, and local HA failover.

Icon of Digital twins capturing real-time operational context to improve diagnostics and maintenance prioritization.

Edge Computer Vision

Industrial cameras (global shutter where required) with inference at the edge (ONNX/TensorRT) for belt tracking, steam/leak detection, and surface defect classification. Includes lens distortion correction and lighting normalization.

Icon of MLOps framework ensures governance, version tracking, security controls, and safe model deployment across environments.

Remote Telemetry (Satellite / LTE-M)

Low-bandwidth, high-latency-tolerant telemetry profiles with prioritized payloads (alarms > summary > raw), delta encoding, and opportunistic backhaul. Forward error correction and DTLS/TLS for secure transport.

Implementation Roadmap

Asset Performance Management Implementation Architecture

Faq

APM is a strategy and software stack that improves asset reliability and performance using sensor data, analytics, and workflows—going beyond preventive to predictive maintenance and measurable OEE gains.

Condition monitoring visualizes health signals; APM software adds risk scoring, failure prediction (RUL), recommended actions, and CMMS/EAM work orchestration.

IoT sensors stream data to edge/cloud models that detect anomalies, estimate Remaining Useful Life (RUL), and trigger guided maintenance before failure.

Common inputs: vibration/acoustics, temperature/IR, electrical (current/voltage/harmonics), pressure/flow, oil quality, speed/load, and relevant PLC/DCS events.

Yes. By preventing unplanned downtime and stabilizing process conditions, APM lifts availability and performance, which raises OEE without extra headcount.

Yes. Modern APM platforms connect to major EAM/CMMS systems and plant historians via OPC-UA, Modbus/TCP, MQTT, and REST APIs.

No. Unsupervised anomaly detection delivers early wins; labeled data later improves failure-mode classifiers and RUL accuracy.

Edge: fast feature extraction and first-line detection when connectivity is limited. Cloud: fleet learning, model retraining, and cross-site benchmarking.

Accuracy depends on sensor quality, sampling, operating variability, and model maturity. A good program tracks error bands and continuously retrains on new outcomes.

Typical pilots run 6–12 weeks: connect data, baseline normal behavior, tune alerts, and validate prevented downtime or reduced alarm noise.

Manufacturing, oil & gas, utilities/energy, mining & metals, transportation/logistics, and any operation with critical rotating or mission-critical assets.

Adaptive thresholds, anomaly scoring, and risk matrices filter noise; SLA-based escalation ensures only actionable, high-risk events page teams.

MTBF, MTTR, asset health index, alarm precision, work compliance, avoided downtime, spare/energy savings, and OEE impact.

Look for RBAC/SSO, encryption in transit/at rest, audit trails, tenant isolation, and clear data-ownership terms; support for cloud, on-prem, or private VPC.

Yes. Gateways and adapters bridge legacy PLCs and newer wireless sensors so you can modernize incrementally.

Preventive follows fixed intervals; predictive maintenance triggers service based on condition and risk, reducing unnecessary work and missed failures.

Recommendations include parts kits and estimated lead times, helping planners align inventory with predicted risk windows.

Yes. Mobile apps support offline data capture and sync, with role-based views for operators, technicians, and managers.

Sum avoided downtime, scrap reduction, labor/parts optimization, and energy savings; compare against subscription, sensors, and deployment effort.

Start with a high-value asset class, template the configuration (sensors, models, rules), then repeat across lines, plants, and fleets.