Make All Operation More Sustainable-In Real Time
PETRAN unifies AI, IoT, and workflows to cut energy use and emissions, conserve water, reduce waste, and prove results, site by site, line by line
PETRAN unifies AI, IoT, and workflows to cut energy use and emissions, conserve water, reduce waste, and prove results, site by site, line by line

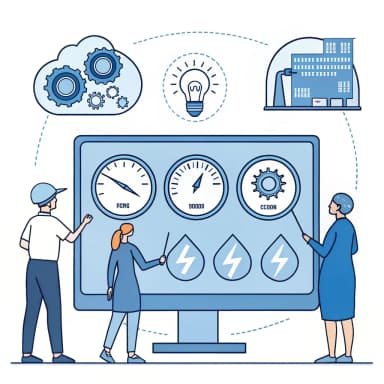
Operational sustainability turns everyday production decisions into measurable environmental improvements without compromising throughput, quality, or safety. Using AI + IoT, Ombrulla captures real‑time data across utilities, processes, and assets, then predicts, prescribes, and automates actions that lower kWh, m³, and tons of CO₂e, while sustaining operational performance.

Reduce energy, water, and materials spend with continuous optimization and automated setpoint control.

Automate GHG accounting and audit-ready evidence for internal and external reporting.

Detect anomalies early, prevent wasteful downtime, and maintain quality during demand or pricing shocks.

Standardize policies and KPIs across plants; replicate best practices in weeks, not quarters.
PETRAN gives you a single, trusted view across energy and utilities (electricity, steam, gas, compressed air, chilled/hot water, renewables), emissions and carbon (combustion data with CO₂e factors, optional fugitive/flaring), water and effluents (intake, process, cooling, discharge with conductivity/temperature), and end-to-end process & asset health (temperature, pressure, flow, speed, torque, quality, vibration, power quality, loading, start/stop) so you can pinpoint losses, prove compliance, and act before issues become downtime.

Monitor electricity, steam, gas, air, water, and renewables to identify losses and load profiles.

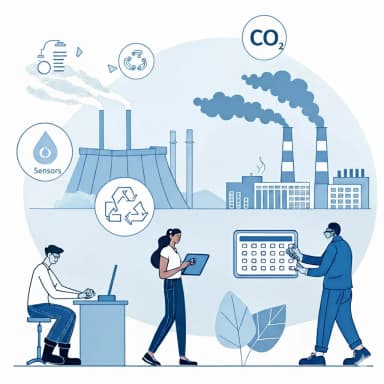
Capture combustion and activity data, calculate CO₂e using regional factors, and include fugitive and flaring emissions.

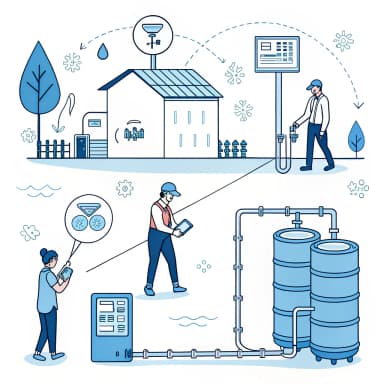
Track water intake, process & discharge with conductivity and temperature to optimize cycles and ensure compliance.

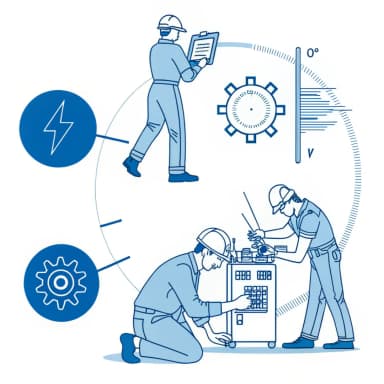
Measure temp, flow, pressure, speed, torque & quality with vibration, power & load data to detect faults.
Unify real-time telemetry with AI-driven anomaly detection, optimization, and closed-loop workflows to cut energy, water, and carbon while lifting yield and uptime. PETRAN ingests plant data at scale, spots inefficiencies before they become losses, automates corrective actions, and streamlines ESG reporting all through open, secure integrations with your historians, control systems, and enterprise apps.

Continuously ingest meters, sensors, and PLC signals (energy, utilities, process variables) for time-aligned visibility across assets.

Detect leaks, steam-trap failures, drift, fouling, compressed-air losses, and suboptimal cycles with evidence-backed alerts.

Apply advanced control to hit target throughput while minimizing kWh, m³, and CO₂e per unit.

Run ISO 50001-aligned baselines, targets, and M&V to verify savings and sustain improvements.

Correlate scrap and rework with process conditions and asset health to pinpoint root causes and reduce losses.

Calculate Scope 1–2 (with integrations for Scope 3) and auto-assemble GHG-aligned evidence packs for disclosures.

Drive every alert to root cause, corrective action, and verification with closed-loop tracking.

Connect historians, BMS/SCADA, LIMS, EAM/CMMS, ERP, and data warehouses with enterprise-grade RBAC/SSO, audit trails, encryption, and cloud/on-prem/VPC options.
A unified data fabric merges production, utilities, and asset health into a single model, enabling faster decisions and cross-functional accountability.
Sub-second detection at the site keeps lines running, while fleet-level learning in the cloud compounds gains across plants.
Standards-based integrations plug into your existing systems, protect prior investments, and keep switching costs under control.
Human-centered UX drives operator and engineer buy-in, backed by governance, RBAC/SSO, audit trails, and encryption that satisfy enterprise requirements.

Well-run programs typically reduce site energy use and CO₂e per unit by ~10–15% within the first 12–18 months, normalized for weather, utilization, and product mix.

Predictive maintenance and condition-based workflows commonly cut ~30–36% of unplanned downtime, lifting throughput and OEE without major capex.

Systematic leak management and tower optimization often save 20–30% of compressed-air load and trim cooling-tower make-up by ~40% with blowdown reductions near ~50%.

Mature diversion programs reach ~90% landfill avoidance, with savings validated via measurement & verification baselines and operational normalization.
Tell us about your challenge - we’re here to help.