What is real-time monitoring in industrial IoT?
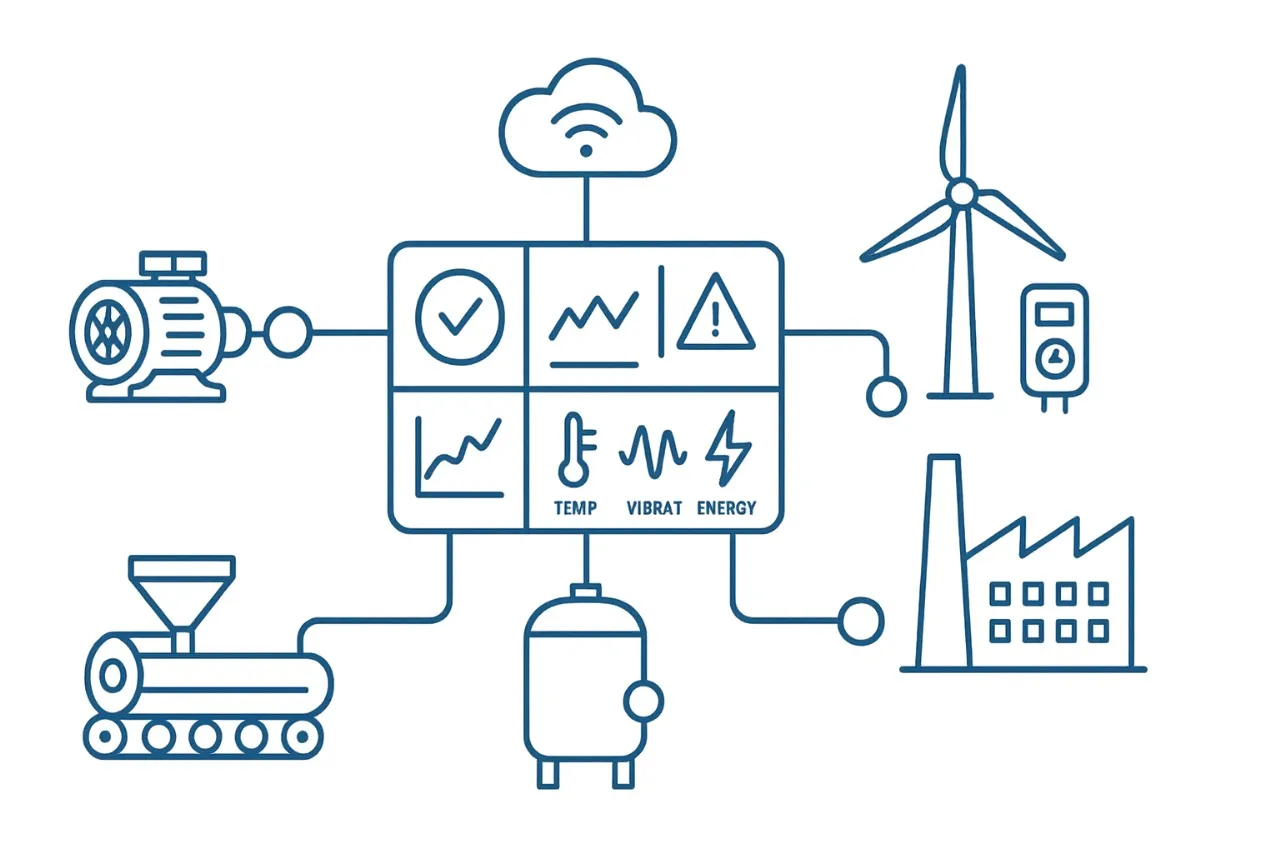
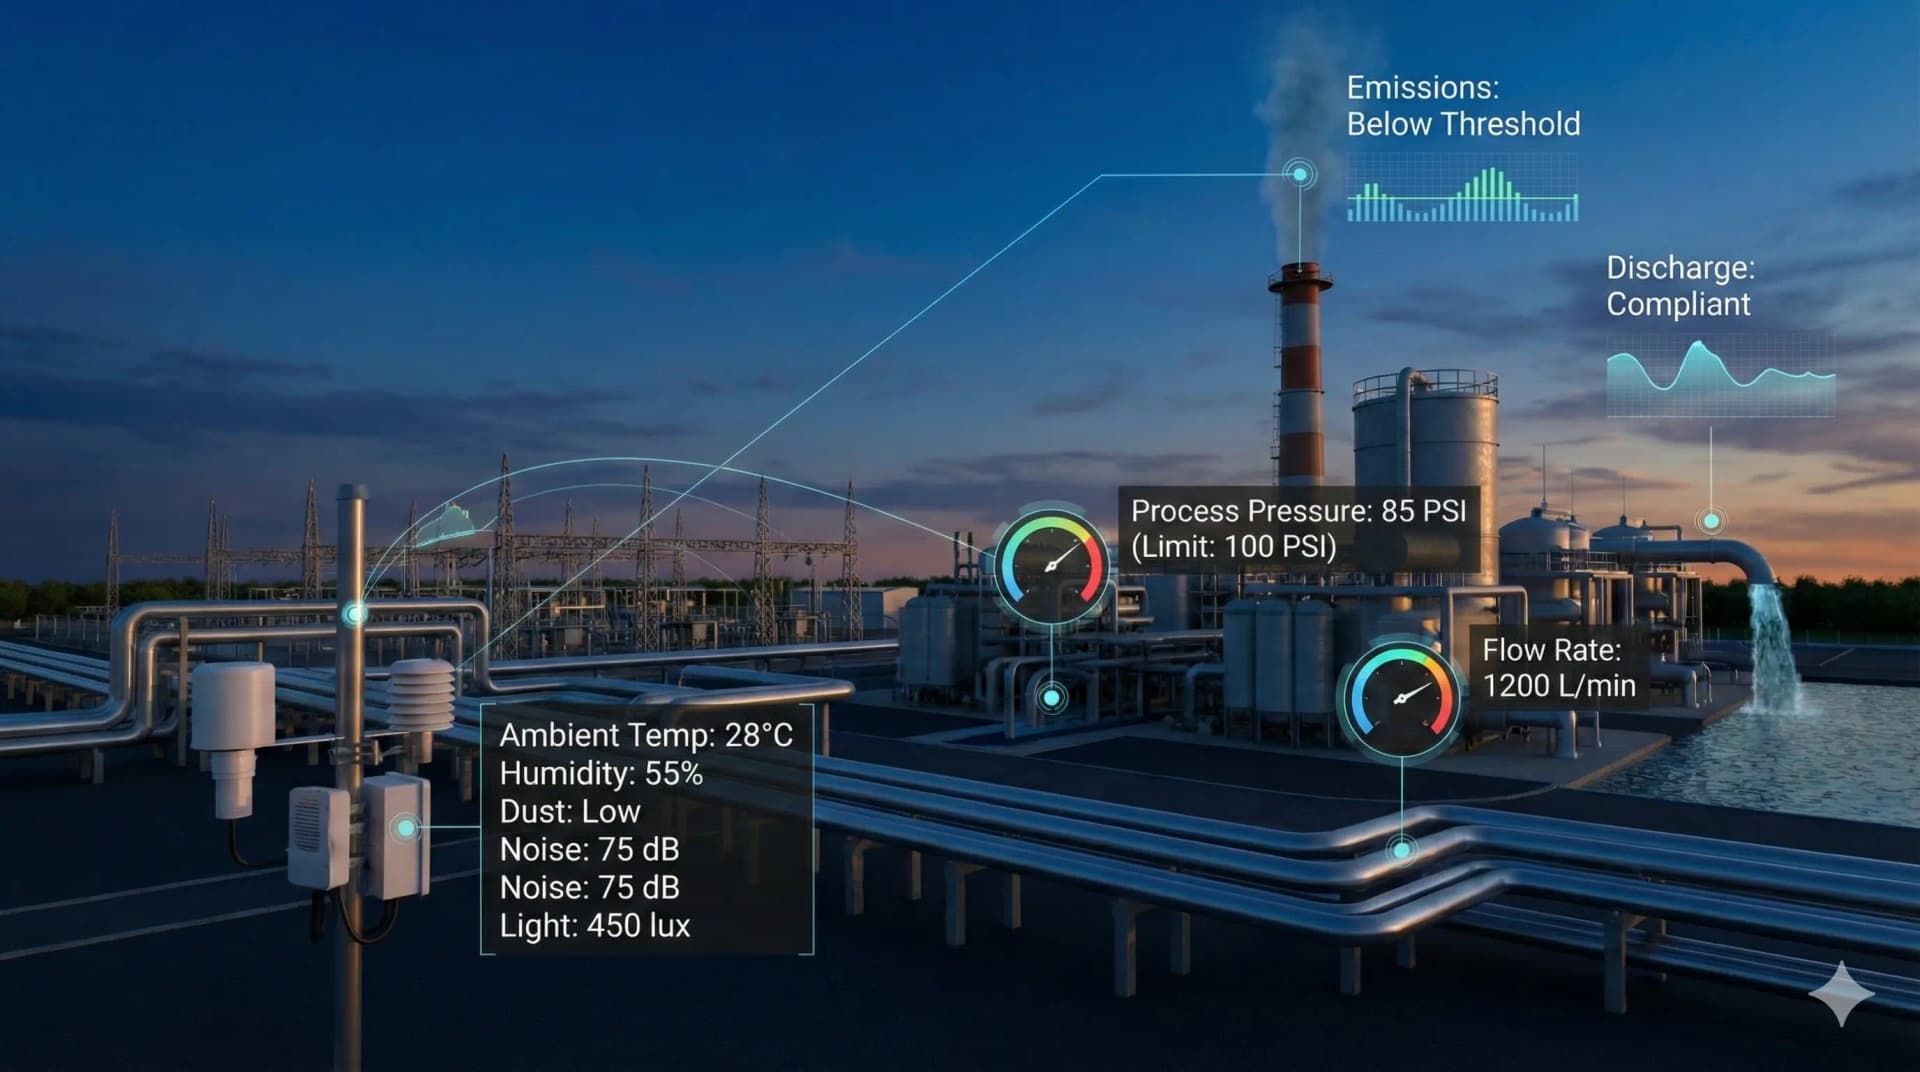
Real-time monitoring in industrial IoT is the continuous collection and AI-powered analysis of live data from connected sensors, RTLS tags, and operational instruments - across assets, workers, animals, and environmental conditions. It provides operations and HSE teams with an always-current view of the operation, so problems are detected before they become failures, incidents, or losses. Real-time monitoring replaces the periodic-inspection model with a continuous-awareness model, where every sensor reading is processed as it happens and AI models surface the correlated patterns that precede issues - typically days or weeks before a fixed-threshold alarm would fire.
How does IoT monitoring differ from Asset Performance Management (APM)?
IoT monitoring is the data layer - collecting real-time signals from sensors and detecting anomalies as they develop. Asset Performance Management is the decision layer - predicting failures, prioritising maintenance work, managing reliability KPIs, and orchestrating the workflows that respond to monitoring insights. Monitoring shows what is happening; APM tells the organisation what to do next. PETRAN delivers both in one platform - eliminating the data-to-decision gap that traditionally separates IoT monitoring from operational action and forces enterprises to integrate two systems where one would suffice.
What problems does real-time monitoring solve?
Real-time monitoring solves five recurring industrial problems that periodic inspection cannot. Unplanned downtime: continuous condition monitoring detects developing failures days to weeks before threshold alarms fire. Worker safety gaps: RTLS, wearable gas sensors, and man-down detection close the visibility gaps that manual safety rounds cannot cover. Energy waste: real-time sub-metering exposes compressed-air leaks, steam-trap failures, and off-hours consumption that utility invoices hide. Animal health losses: physiological and behavioural sensors detect illness 24–48 hours before clinical signs appear. Data silos: a unified data fabric replaces the fragmented dashboards that prevent cross-functional decision-making.
How does real-time monitoring reduce downtime?
Real-time monitoring reduces downtime through three connected mechanisms. First, it detects early warning signs - rising vibration, temperature drift, current imbalance - days before any single sensor crosses a threshold. Second, AI converts those signals into actionable predictions: failure probability, Remaining Useful Life, and recommended intervention windows. Third, it automatically routes the prediction into the CMMS as a prioritised work order, with sensor evidence attached. The combined effect typically reduces unplanned downtime by 20–40% on critical assets - converting emergency repairs into planned maintenance during scheduled production windows.
What is a good starting point for IoT monitoring?
The best starting points for IoT monitoring are areas where the data foundation is straightforward, the failure modes are well-understood, and the ROI is rapid and measurable. High-impact options include bottleneck production machinery (a single hour of downtime saved pays for the sensor), rotating equipment (pumps, motors, compressors with well-characterised failure signatures), compressed-air systems (20–30% of compressed-air energy is typically wasted), lone worker safety (clear regulatory driver, immediate safety impact), and high-value livestock monitoring (24–48-hour early disease detection delivers visible welfare and cost outcomes). Choose one high-value area, validate, then scale.
What sensors are required for condition monitoring?
Condition monitoring sensor selection depends on the asset type and the failure modes you want to detect. The most common sensor categories are: vibration (tri-axial accelerometers for rotating equipment - detects bearing wear, misalignment, imbalance), temperature (PT100 or thermocouples for thermal monitoring of bearings, windings, and process media), pressure (gauge and differential pressure transmitters for fluid systems), flow (Coriolis, magnetic, ultrasonic, depending on fluid), and electrical (current transformers, power quality meters for motor health). For livestock, GPS for location and accelerometer-based activity sensors are widely used. The Discovery phase maps required sensors against existing instrumentation gaps.
What is the difference between SCADA and IoT monitoring?
SCADA (Supervisory Control and Data Acquisition) focuses on real-time control and plant-level monitoring of industrial control systems - its strength is millisecond-latency control loops on a single plant. Industrial IoT monitoring provides multi-site visibility, AI-driven analytics, cloud-scale data storage, and enterprise integration across assets, workers, animals, and environments. The two are complementary: SCADA remains the system of record for control; IoT monitoring extends it with cross-site analytics, predictive insights, and enterprise workflow integration. PETRAN ingests data from SCADA via OPC-UA without disrupting control operations - adding intelligence on top of the control layer rather than replacing it.
What is edge monitoring?
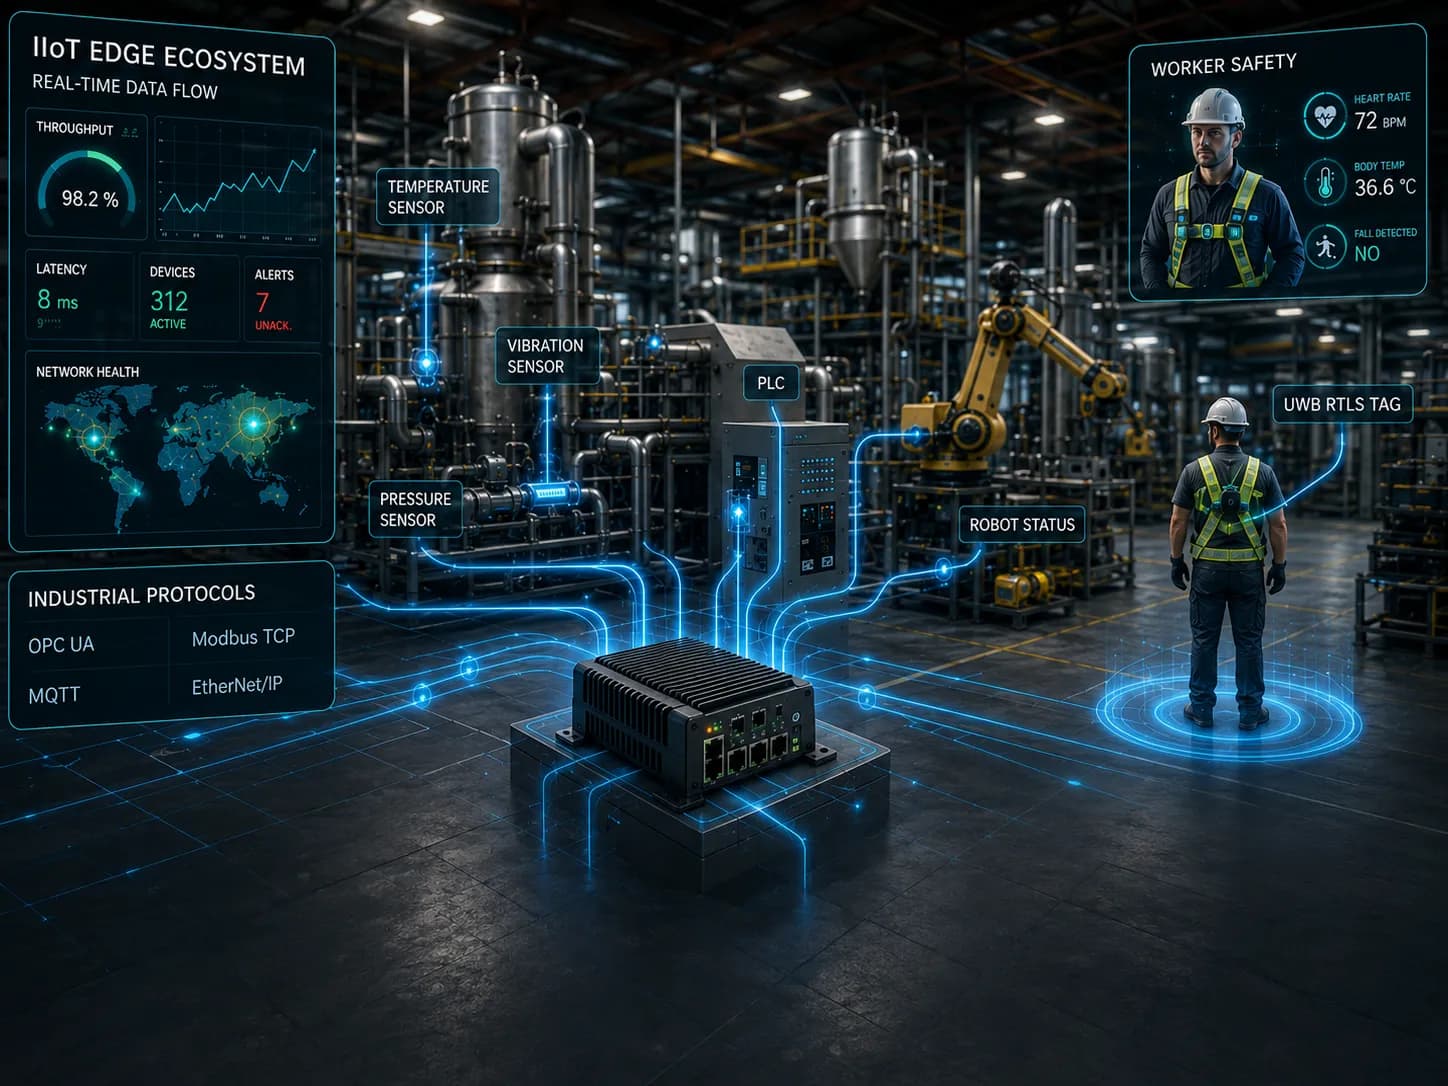
Edge monitoring processes sensor data close to the source - on industrial gateways, local servers, or directly on the device - rather than transmitting all data to the cloud for analysis. The advantages are significant: alert latency drops from seconds to under one second, operations continue during cloud connectivity outages, sensitive data does not need to leave the site, and network bandwidth and cloud-processing costs are reduced. PETRAN's edge AI runs safety-critical detection (gas exceedance, man-down, fall) locally for sub-second response, while cloud AI handles fleet-wide pattern learning that benefits from accumulated data across many sites.
How does alerting work without becoming noisy?
Alert fatigue is one of the most common reasons IoT monitoring deployments fail. PETRAN reduces it through four mechanisms deployed together. Threshold rules handle safety-critical, deterministic conditions. Trend detection catches conditions that develop gradually below any single threshold. AI anomaly detection identifies multivariate patterns that no single rule could capture. Persistence rules require a condition to remain present for a configured period before escalating. Combined with severity scoring and asset-criticality weighting, this filters routine signal noise out and surfaces only the alerts that genuinely require action - typically reducing alert volume by 80–95% compared with raw threshold-based monitoring.
What is anomaly detection?
Anomaly detection is the use of AI and machine learning to identify deviations from learned normal operating behaviour - rather than relying solely on fixed thresholds set at deployment. It works by building a multi-dimensional model of how an asset, worker, or animal normally behaves across all operating modes (load, shift, season, product mix), then flagging when current behaviour diverges from that envelope. The advantage is significant: anomaly detection catches the subtle, correlated, multi-signal patterns that precede failure days or weeks before any single parameter crosses a fixed threshold - converting reactive monitoring into genuine early-warning capability.
Can IoT reduce energy costs?
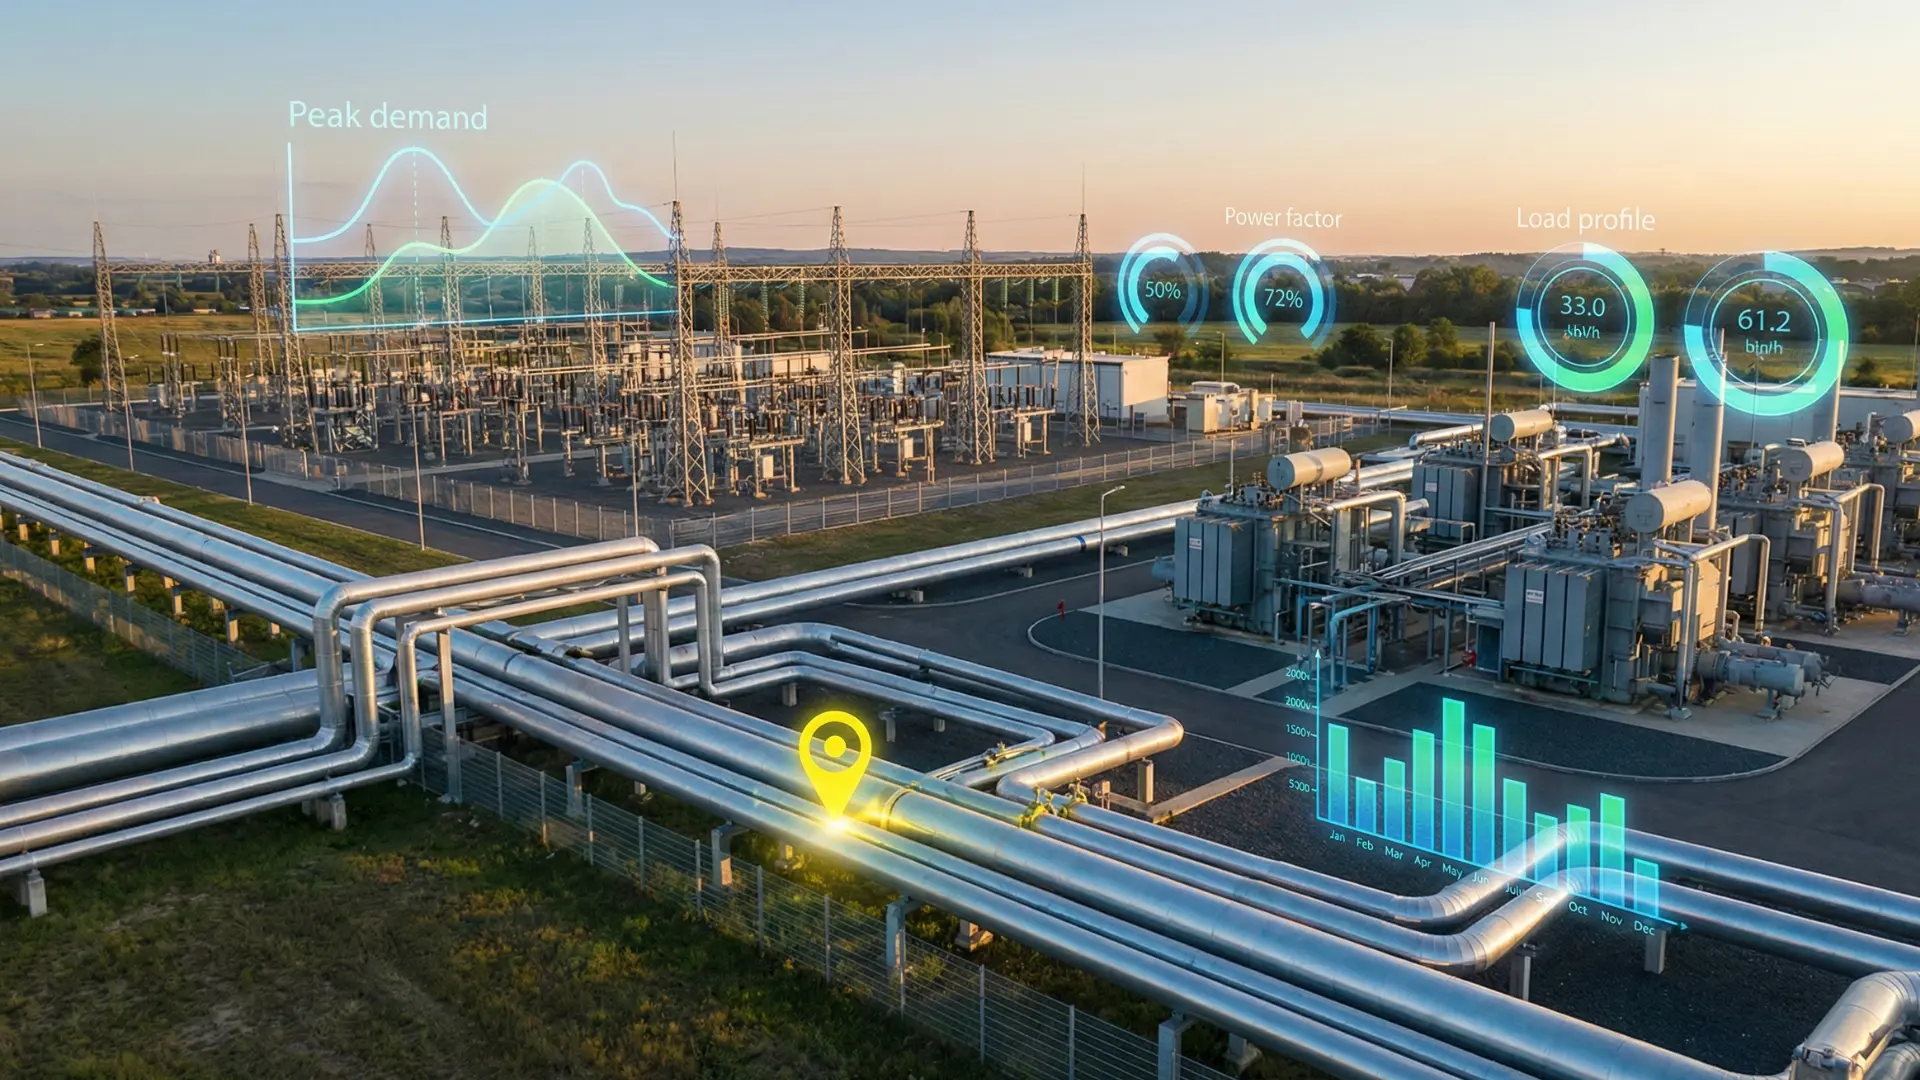
Yes. Energy monitoring typically delivers the fastest ROI of any IoT monitoring use case. PETRAN identifies off-hours energy consumption (equipment running outside production windows), compressed-air leaks (20–30% of compressed-air energy is typically lost), steam-trap failures, peak demand spikes that drive utility charge multipliers, and inefficient equipment operating outside its optimal envelope. The combined effect typically saves 10–20% of total energy spend across an industrial site within 6–12 months - with savings verified through ISO 50001 Measurement and Verification methodology, not vendor estimates. The fastest wins are usually in compressed air, lighting controls, and HVAC sequencing.
How does IoT monitoring support safety?
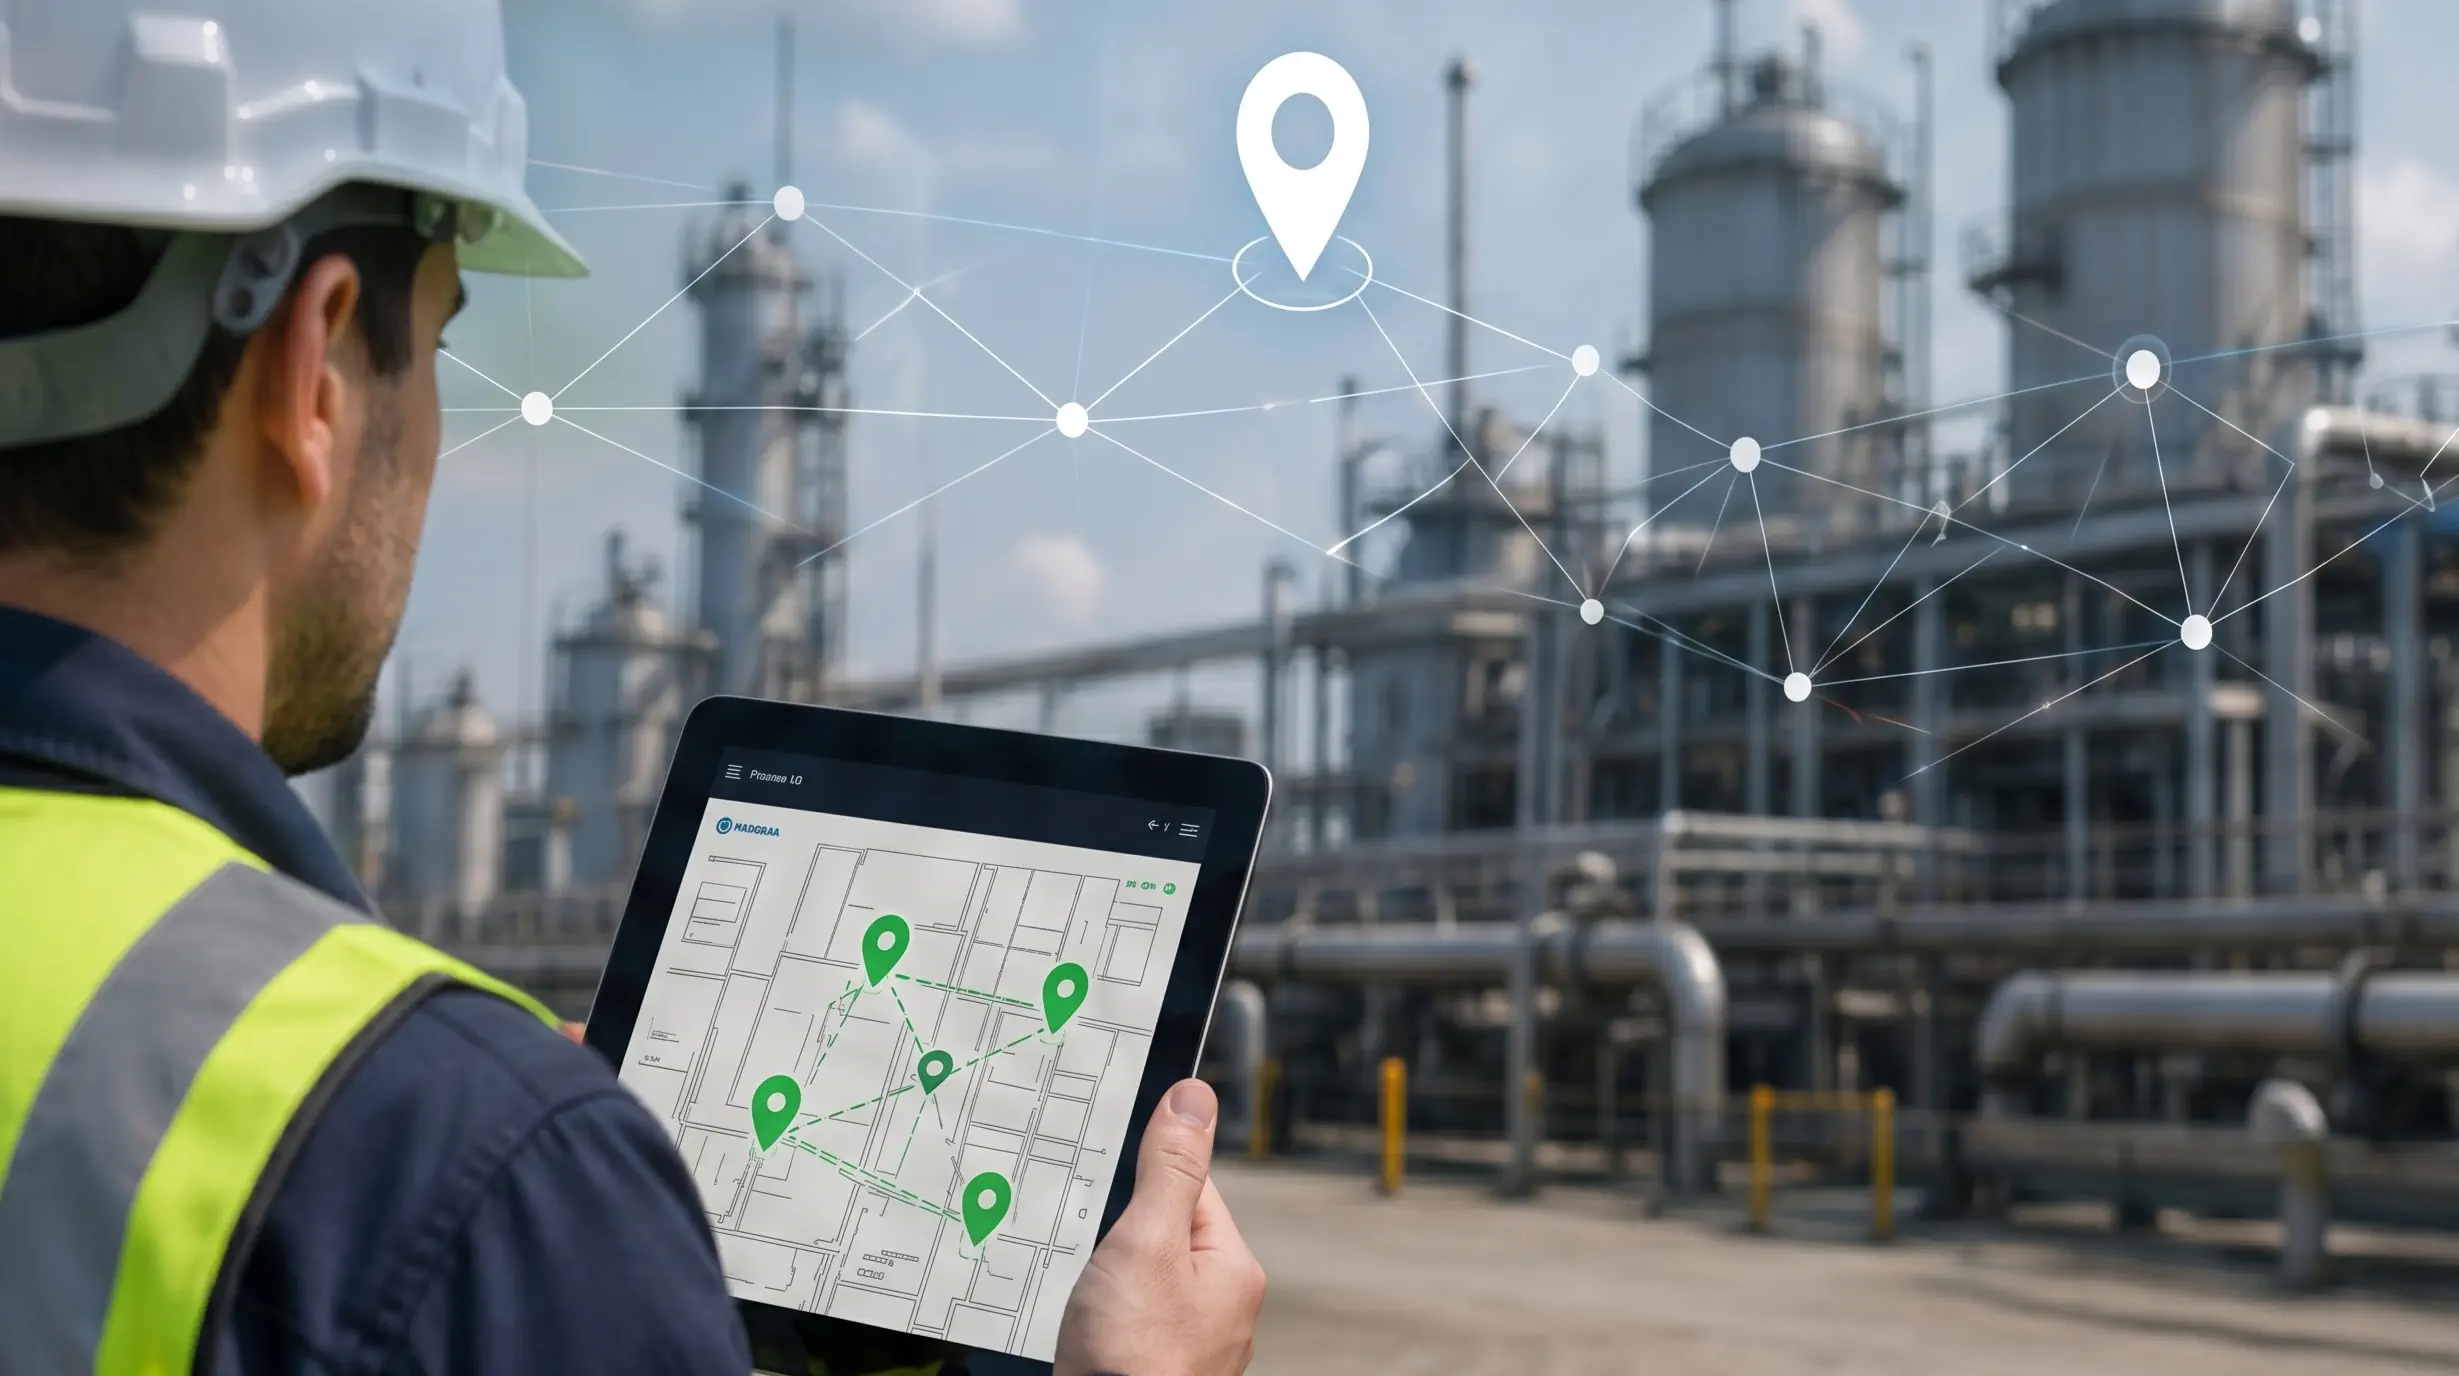
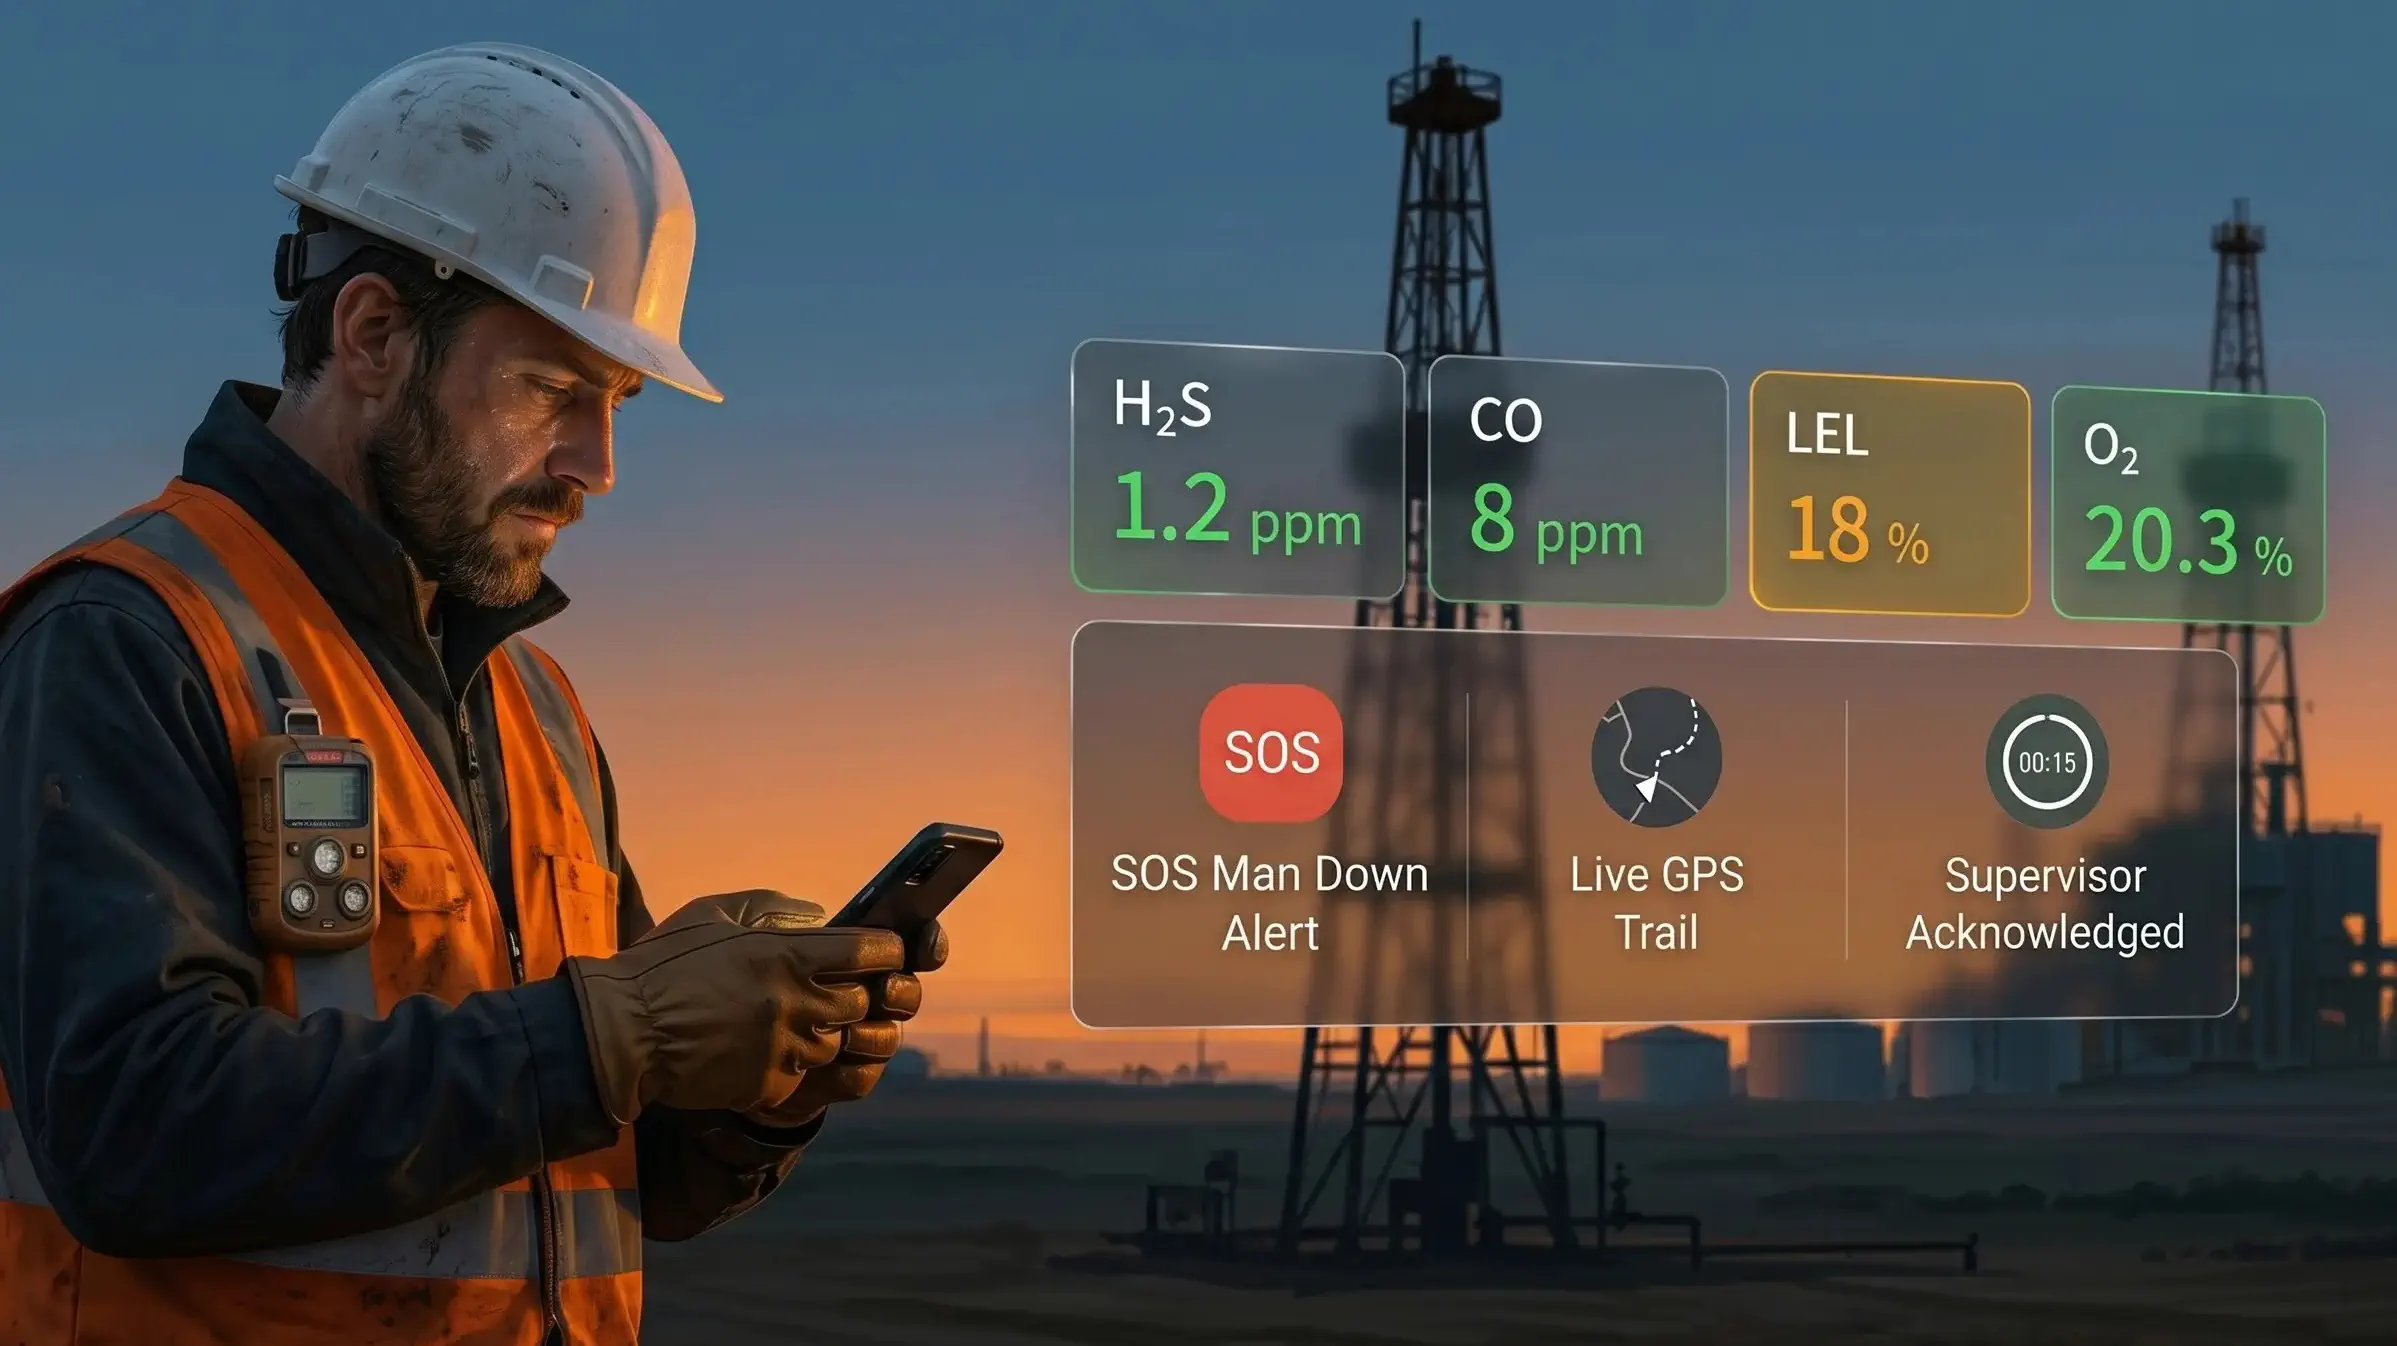
IoT monitoring supports safety across the full HSE lifecycle. Real-time gas exposure monitoring tracks worker TWA and STEL accumulation against OSHA PEL and ACGIH TLV thresholds. RTLS tracks worker location continuously, with geofencing enforcing restricted-zone access and Permit-to-Work compliance. Man-down detection and lone-worker check-ins close the response-time gaps that manual safety rounds cannot cover. Every safety event is logged in an immutable, timestamped audit trail - supporting compliance with HSW Act 1974, MHSWR 1999, ISO 45001, OSHA PSM, BS 8484, and RIDDOR 2013. The result is measurable safety performance and defensible compliance evidence on demand.
How does IoT integrate with CMMS/EAM?
IoT and CMMS/EAM integration closes the loop between monitoring insight and maintenance action. When PETRAN detects a developing fault - bearing wear pattern, abnormal vibration, thermal anomaly - it automatically creates a work order in the CMMS (IBM Maximo, SAP PM, Infor EAM, ServiceNow) with diagnostic evidence attached: sensor charts, severity score, recommended action, and SLA window. Completed-work outcomes flow back through the same integration to retrain the model and improve future detection accuracy. The integration eliminates manual transcription, accelerates response, and creates a complete traceability chain from sensor reading to closed work order.
How long does implementation take?
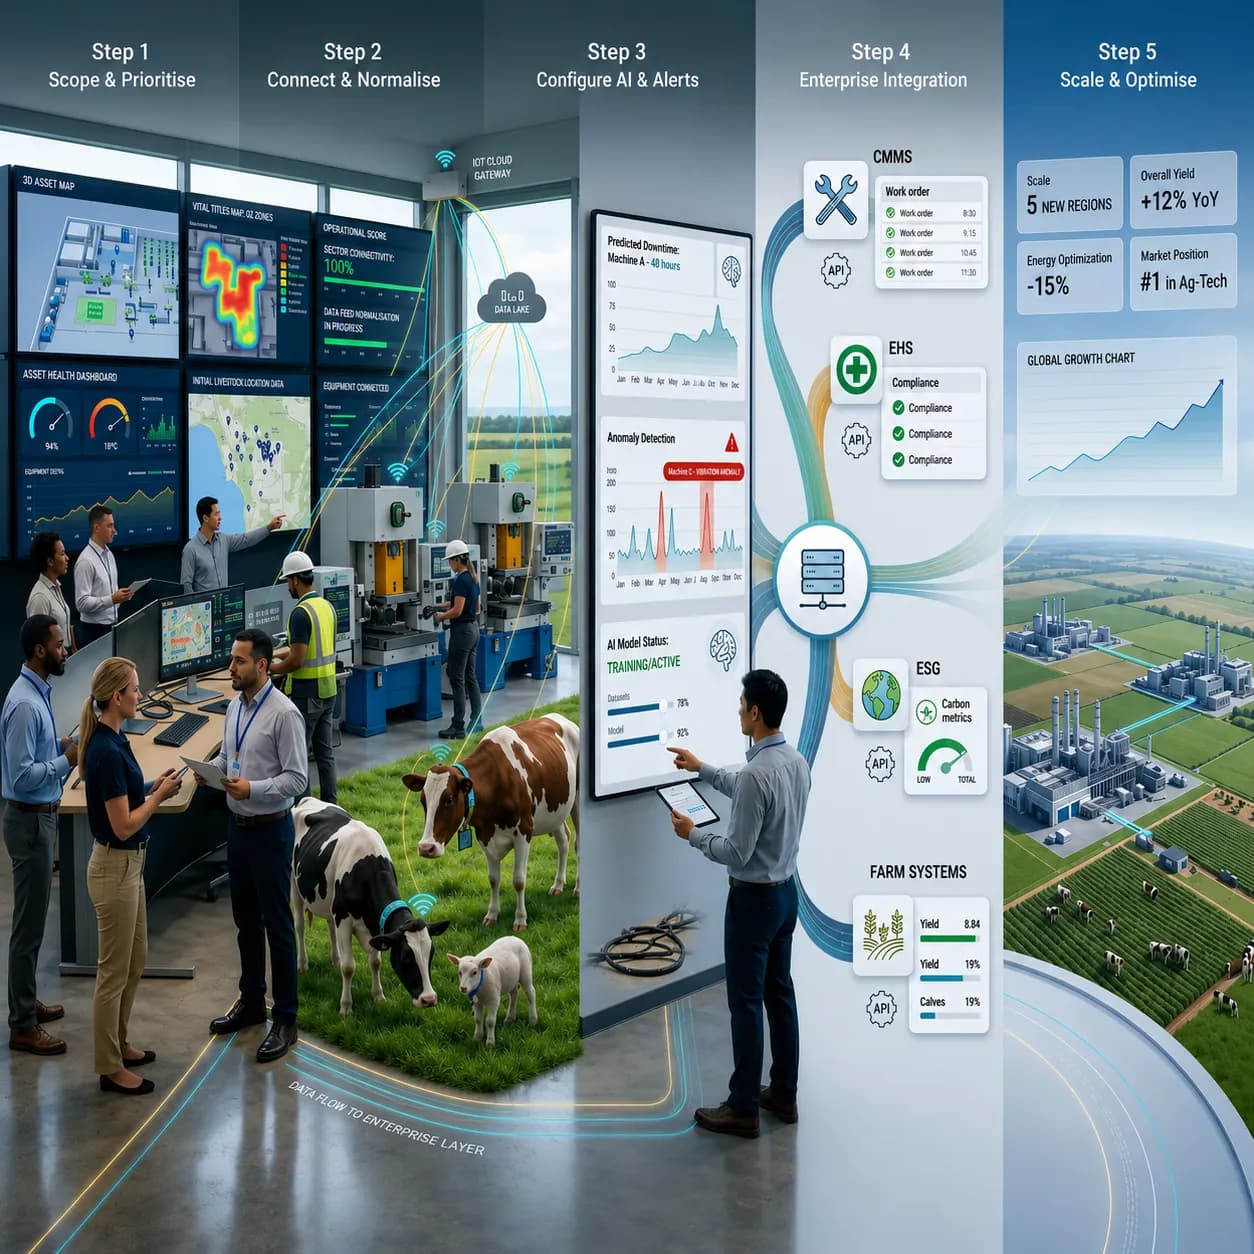
PETRAN implementation typically takes 7–16 weeks for the first deployment, depending on scope, integration complexity, and the monitoring domains in scope. The standard timeline is: 1–2 weeks Scope and Prioritise, 2–6 weeks Connect and Normalise (hardware install and integration), 2–4 weeks Configure AI and Alerts (baseline learning and threshold tuning), and 2–4 weeks Enterprise Integration (CMMS, EHS, ESG, BI). Additional sites after the first one typically deploy in 2–4 weeks each, using the configuration templates established during the initial deployment. Multi-domain deployments (assets + workers + animals) take slightly longer than single-domain pilots.
What does a good dashboard look like?
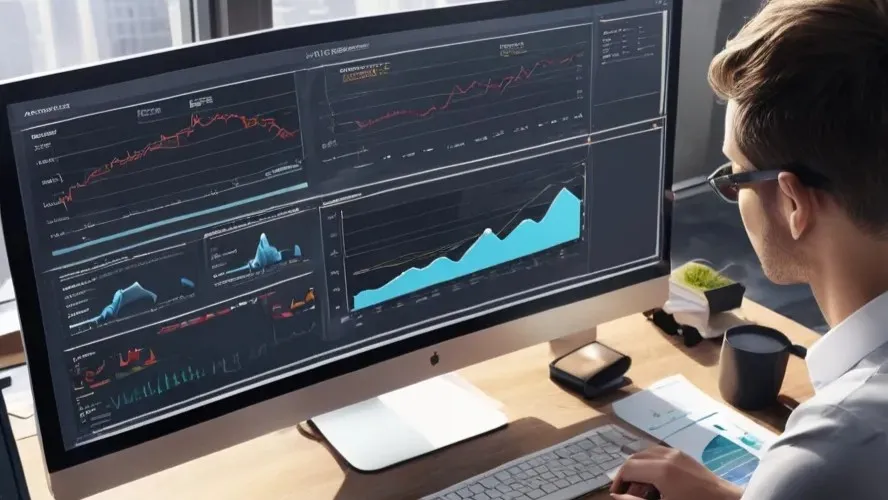
A good IoT monitoring dashboard is role-based, not feature-based. The frontline operator sees live equipment status, active alerts, and the specific actions they need to take this shift. The maintenance team sees asset health scores, work order queue, and predictive insights for next-shift planning. The safety team sees worker positions, gas exposure, active permits, and incident timeline. Management sees OEE, downtime trends, energy intensity, safety performance, and ROI against targets. Each dashboard is configurable, drill-down enabled (every KPI traceable to source data), and mobile-responsive - because operational decisions happen on the floor, not at a desk.
What does an IoT monitoring solution cost?
PETRAN pricing depends on five factors: number of assets, workers, or animals monitored; hardware required (gateways, sensors, wearables, tags); connectivity (cellular, LoRaWAN, satellite); enterprise integration scope (CMMS, EHS, ERP, BI); and deployment model (cloud, on-premises, hybrid). Costs are typically calculated per site or per asset on an annual platform subscription, with one-time hardware and implementation costs covered separately. Most enterprises find that monitoring a small set of high-value assets, workers, or animals delivers ROI inside the first year - covering the multi-year platform commitment. Detailed pricing is provided after the Discovery phase scopes the deployment.
What are common use cases?
Common IoT monitoring use cases span the four PETRAN domains. In asset monitoring: predictive maintenance on rotating equipment, energy and utility monitoring, process variable tracking, condition-based maintenance scheduling. In worker safety: RTLS-based lone worker monitoring, gas exposure tracking, man-down detection, Permit-to-Work compliance. In animal tracking: livestock location and theft prevention, health monitoring and early disease detection, calving and oestrus alerts, virtual pasture geofencing, wildlife conservation. In operations: real-time OEE, automatic stoppage capture, bottleneck identification, command-centre dashboards, and objective shift-to-shift handover.
How does PETRAN fit into IoT monitoring?
PETRAN extends IoT monitoring from observation to action. Most IoT monitoring platforms stop at dashboards: they show what is happening, but the decision and the action remain manual. PETRAN closes the loop. AI-driven anomaly detection identifies developing issues; the platform converts findings into prioritised CMMS work orders, EHS incident records, or farm-management treatment workflows; and the outcomes flow back through enterprise integrations to retrain the models. The shift is from a monitoring system that produces alerts to a connected-operations platform that produces measurable outcomes - across asset, worker, animal, and operations domains in a single architecture.
How does IoT animal tracking work?
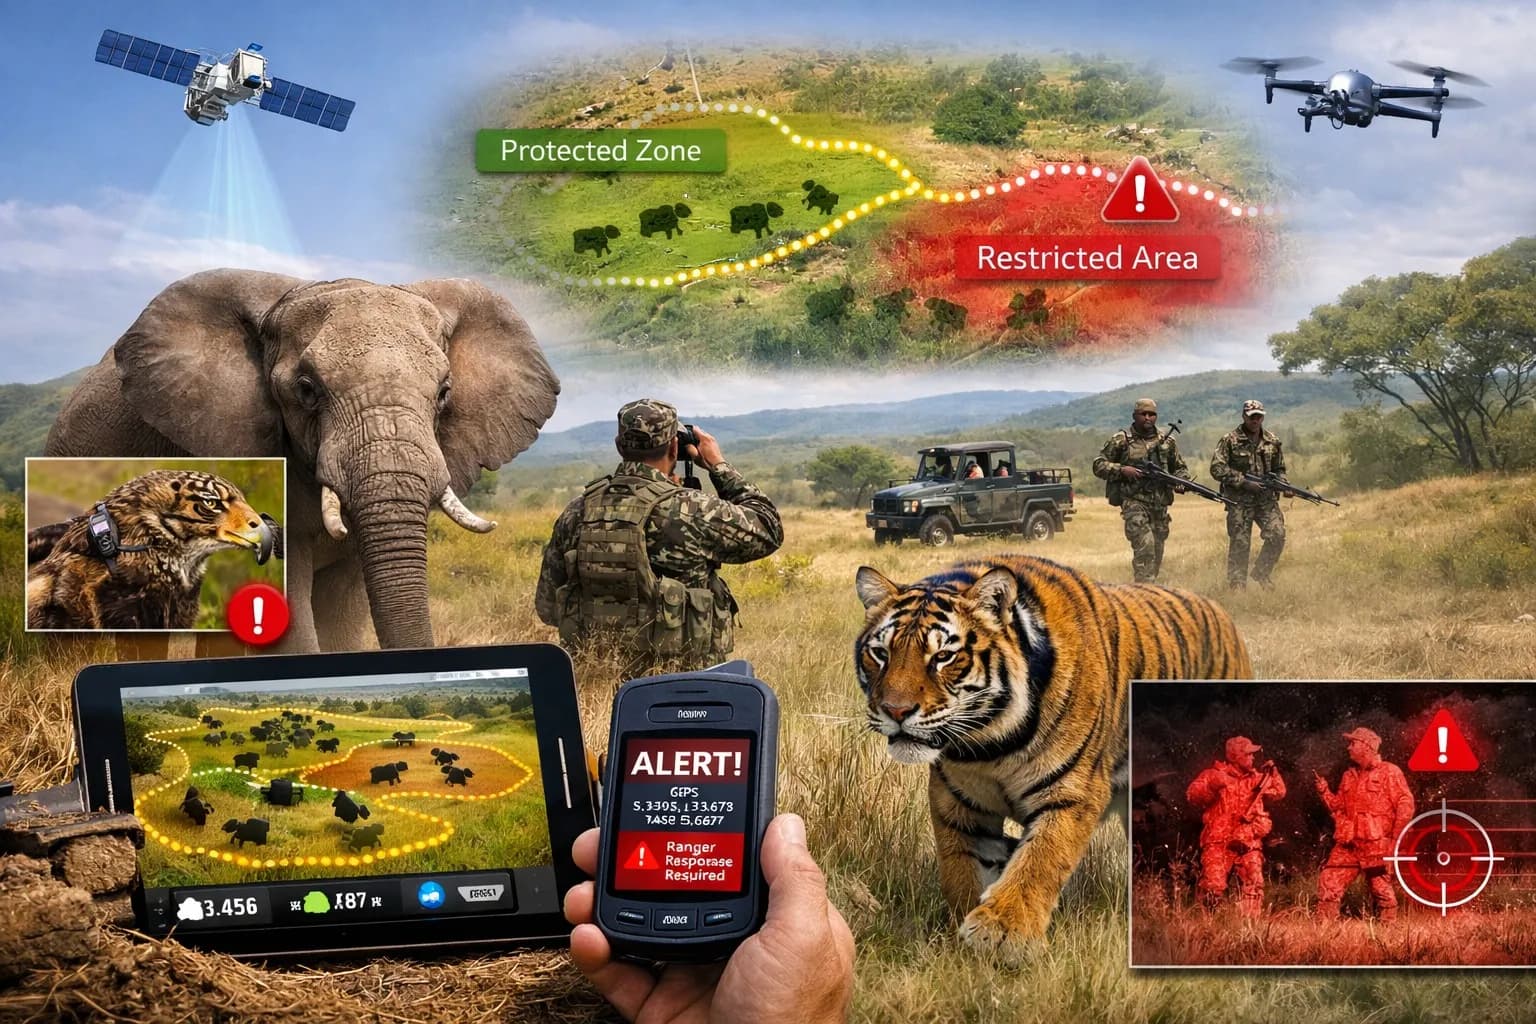
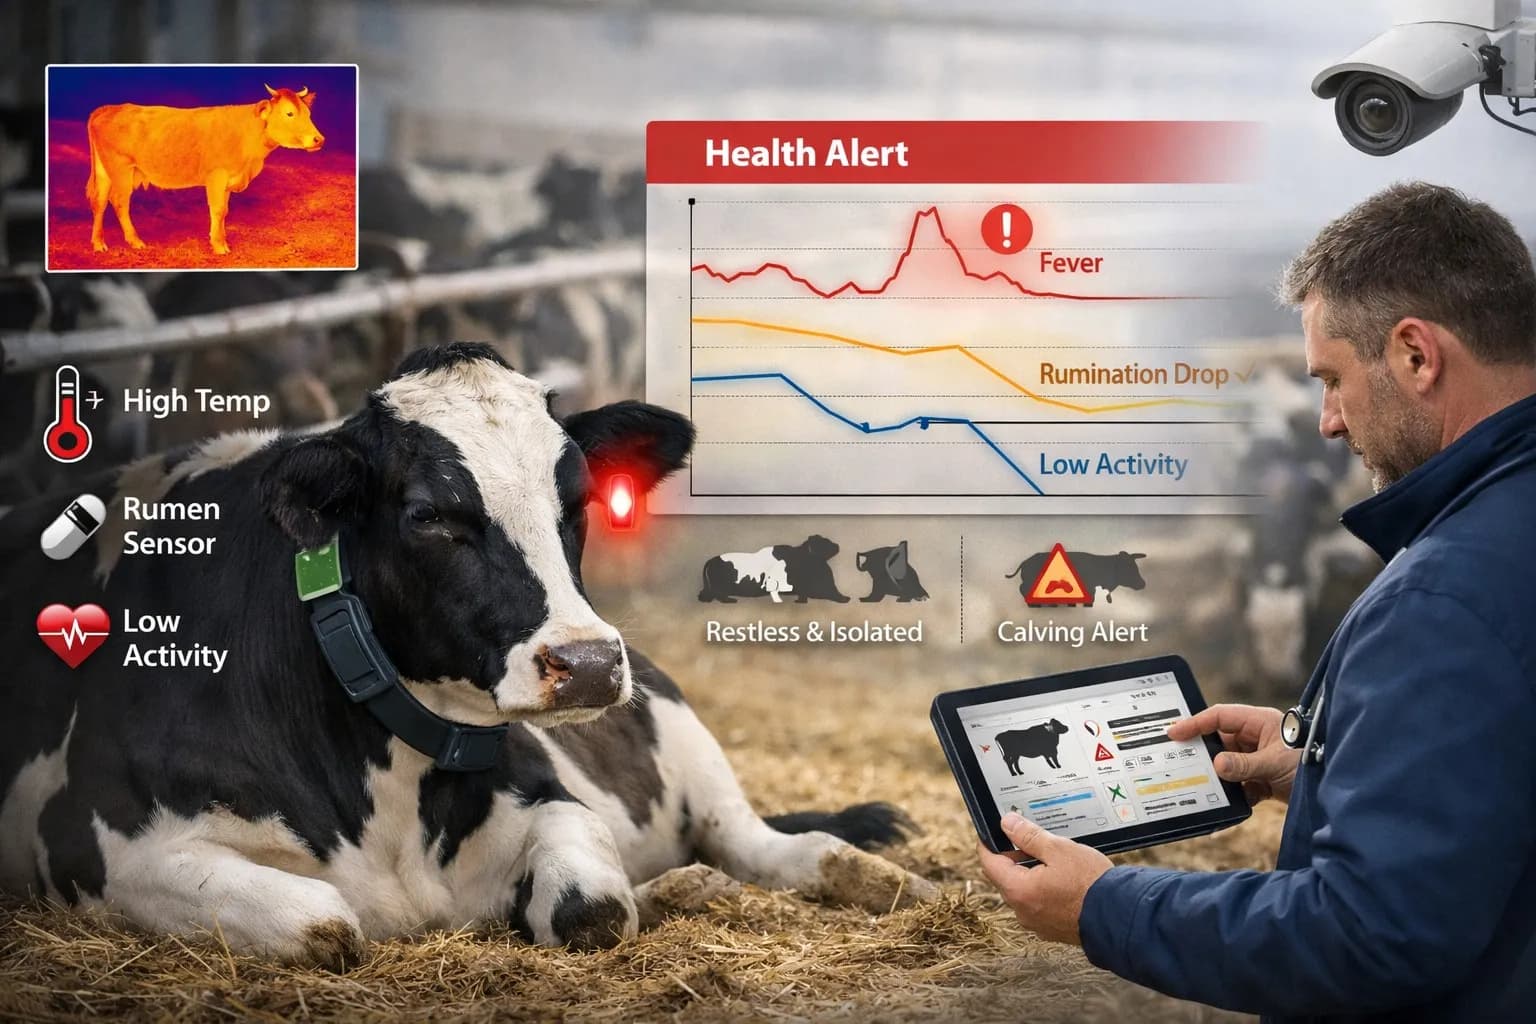
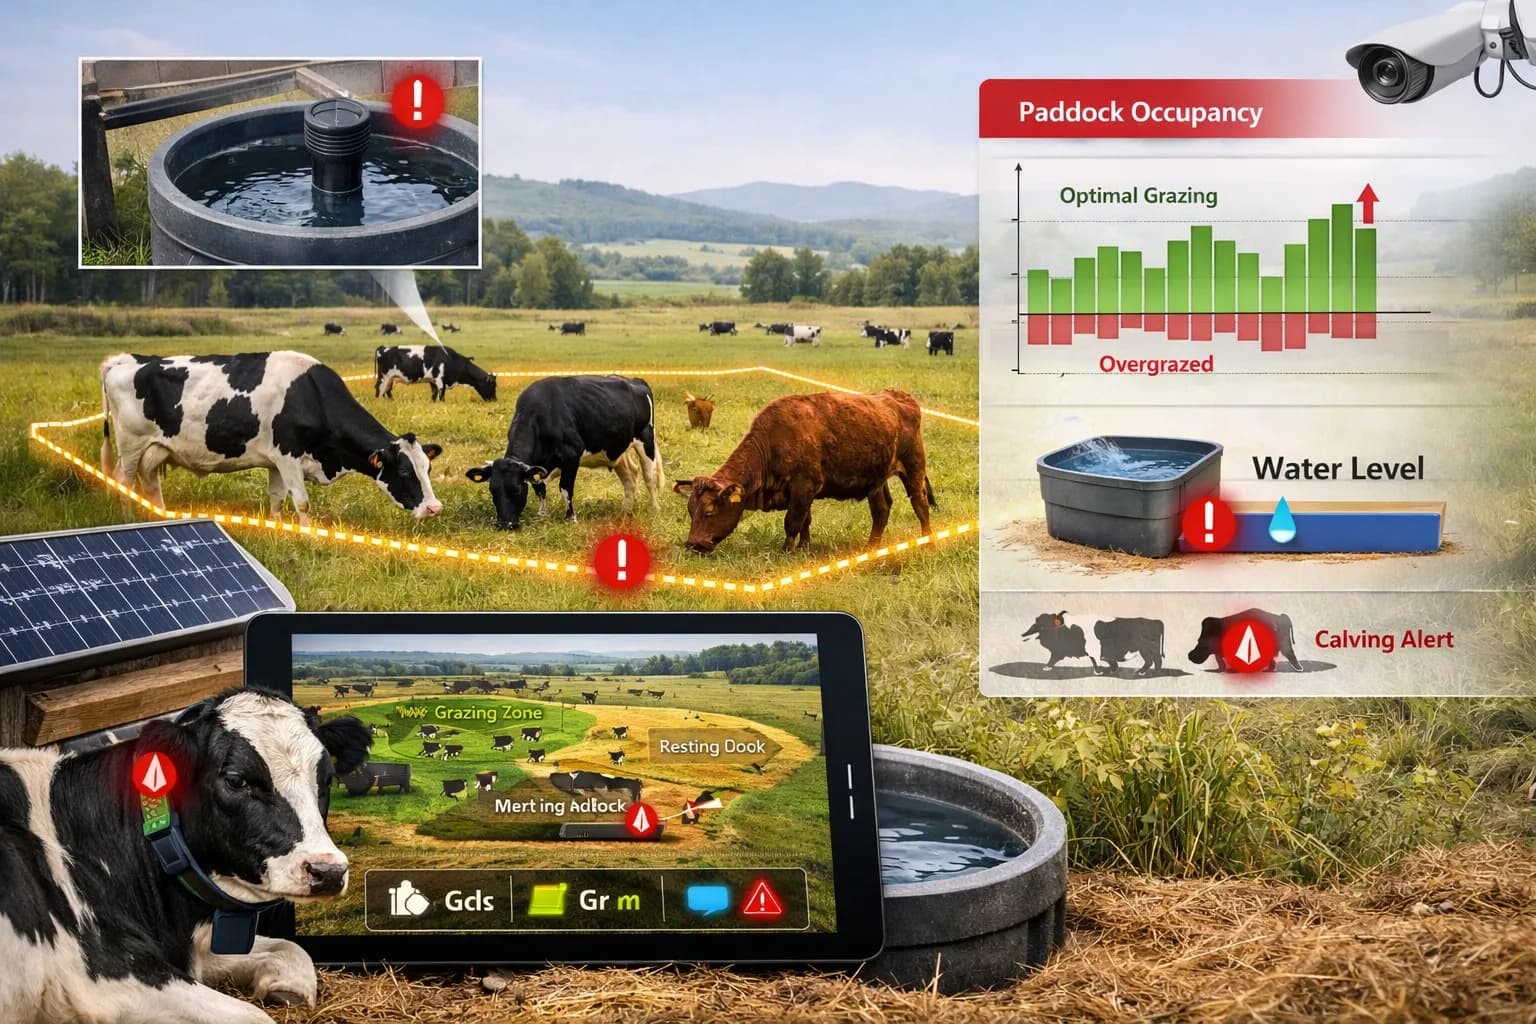
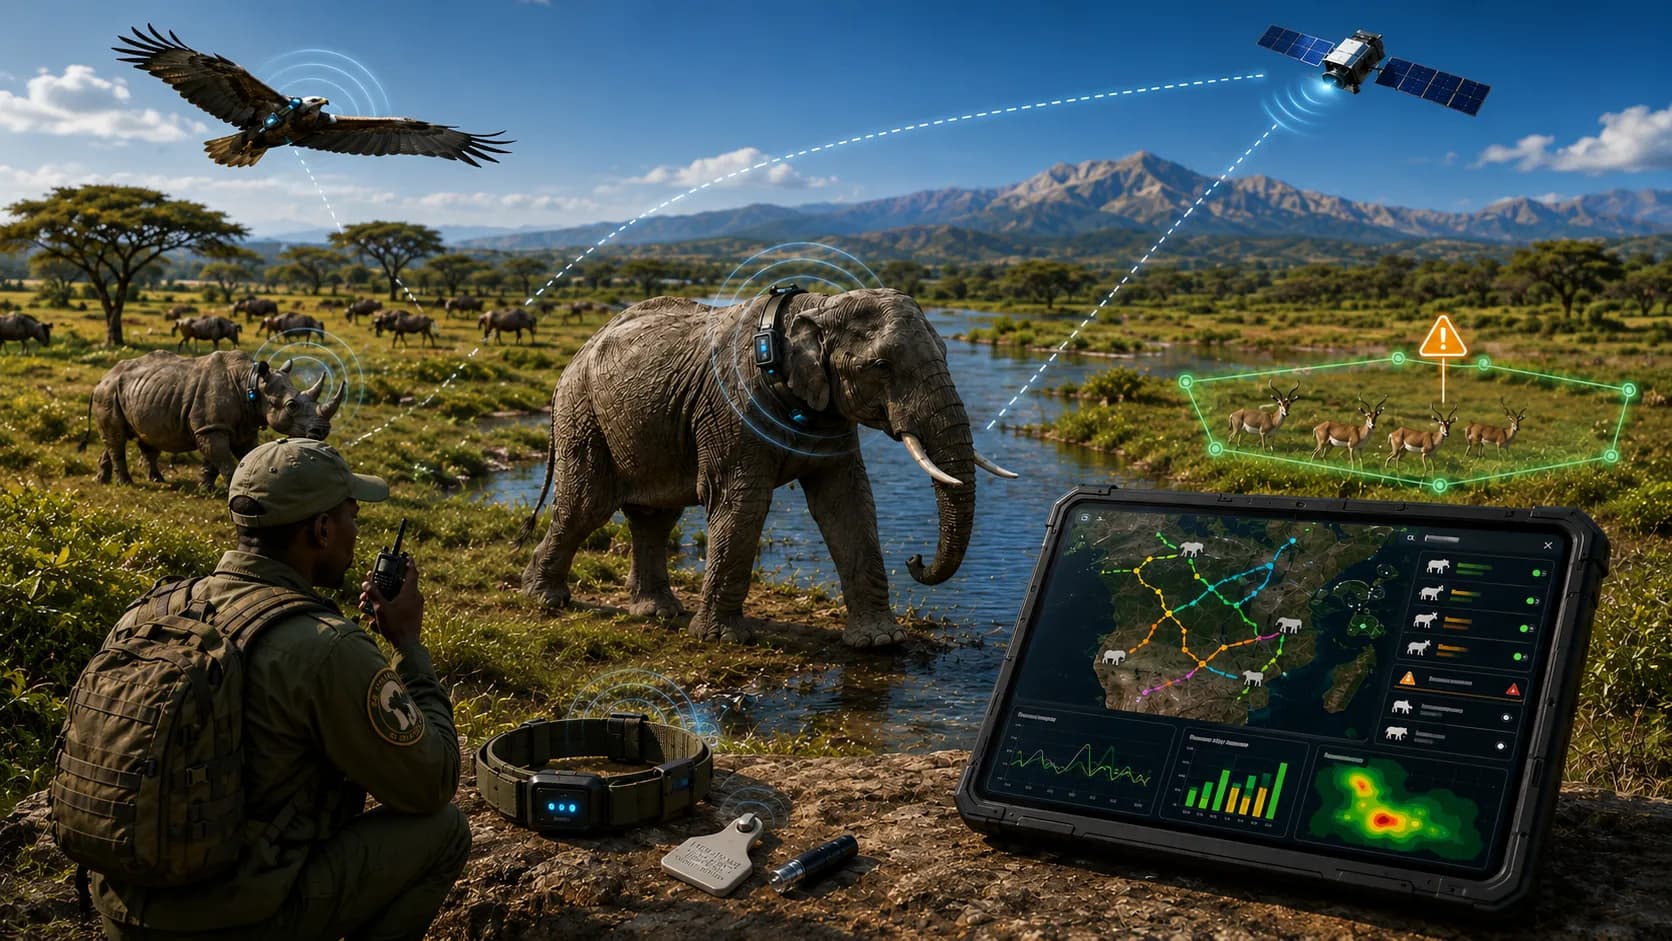
IoT animal tracking uses purpose-built sensors - GPS collars, LoRaWAN ear tags, BLE bolus sensors, leg bands - to continuously monitor each animal's location, movement, behaviour, and physiological parameters. Sensor data is transmitted via LoRaWAN (low-power, long-range, multi-kilometre coverage), cellular (LTE-M, NB-IoT), or satellite (Iridium, Globalstar) - whichever is most appropriate for the deployment's geography and density. AI models on PETRAN's platform analyse the data to detect early illness indicators, alert farmers to calving and oestrus events, enforce virtual pasture geofences, and provide the welfare and traceability evidence required by food-chain and regulatory frameworks.
What are the benefits of livestock monitoring?
Livestock monitoring delivers four primary benefits with measurable economic and welfare impact. Early disease detection: physiological and behavioural sensors identify illness 24–48 hours before clinical signs are visible, reducing treatment cost, antibiotic usage, and mortality. Labour savings: virtual geofencing and automated headcount eliminate the daily manual rounds that historically consumed disproportionate labour hours. Better breeding outcomes: precise calving and oestrus alerts improve conception rates, calf survival, and herd productivity. Improved compliance: full traceability and welfare evidence support frameworks including UK CTS, USDA NAIS, and customer-specific welfare audit requirements - protecting market access and price premiums.
What connectivity is used for tracking?
IoT tracking deployments use a layered connectivity strategy depending on geography, density, and update frequency requirements. LoRaWAN is the workhorse for animal tracking: low power, multi-kilometre range (up to 15 km open terrain), 1–2 year battery life on collars and ear tags. LTE-M and NB-IoT cover deployments where cellular infrastructure exists and slightly higher update rates are needed. GPS provides outdoor positioning across all device types. Satellite (Iridium, Globalstar) provides fallback connectivity for the most remote sites where no cellular or LoRaWAN gateway coverage is possible - for example, remote ranches, offshore platforms, or wilderness conservation areas.