Benchmarking Custom AI: Creating Domain‑Specific Challenge Sets
Abstract
Off-the-shelf benchmarks have driven major advances in artificial intelligence, but organizations deploying custom AI solutions for enterprise-scale optimization often discover that public leaderboards fail to predict real-world performance. Teams building custom AI and custom AI development workflows need evaluation methods that reflect their actual operational context, not generic benchmark tasks.
To achieve this, domain-specific challenge sets carefully curated collections of tasks, inputs, and gold-standard outputs are essential. These challenge sets mirror real production usage and help organizations measure quality, safety, efficiency, and robustness across specific industries and workflows. They are especially critical for teams delivering AI software and enterprise-grade AI solutions.
This white paper provides a comprehensive methodology for designing, building, and operating domain-specific challenge sets for LLMs, RAG pipelines, vision-language systems, and tool-augmented agents. We define foundational principles, governance structures, and measurement frameworks; propose a taxonomy of task types; and outline detailed processes for data sourcing, annotation, and quality control key elements for modern AI software development.
In addition, we present scoring schemes, statistical power analysis, difficulty calibration procedures, and patterns for bias and safety audits. The paper also covers privacy-preserving dataset construction and lifecycle management.
Introduction
Organizations increasingly deploy custom AI for specialized tasks-contract analysis, medical summarization, industrial inspection, customer support deflection, risk scoring. While general benchmarks (e.g., MMLU, GSM8K, HELM) track broad capabilities, they rarely predict task success in a specific domain with its idiosyncratic documents, data quality, constraints, and policies. Performance in production depends on many factors beyond raw model capability: retrieval freshness, OCR errors, domain terminology, strict formatting contracts, and policy compliance. Absent a domain‑specific challenge set, teams fall back to anecdotal testing and demo‑driven decisions, which introduce regressions and erode trust.
This paper provides a rigorous playbook for constructing challenge sets that answer the questions stakeholders actually care about: Will the system extract the right fields under scanning noise? Will it cite evidence? Will it avoid disallowed advice? What will it cost at scale? We emphasize explainable AI for transparent enterprise systems through measurement integrity, coverage, robustness, and governance. We emphasize measurement integrity (clear task definitions, gold standards, inter‑rater reliability), coverage (representative task distributions and cohorts), robustness (stress/adversarial cases), and governance (privacy, provenance, audit). The end state is a living benchmark that underwrites release decisions, SLAs, and continuous improvement.

Principles of Domain‑Specific Benchmarking
1. Fitness-for-purpose: Each task maps to a production user story and acceptance criteria, ensuring alignment with real-world requirements in custom AI solutions for enterprise-scale optimization.
2. Cohort‑aware coverage: Stratify by document/source type, language, quality (e.g., scan vs. digital), time period, and risk tier.
3. Grounded evaluation: Prefer evidence‑based metrics over subjective impressions; require citations where applicable.
4. Reproducibility: Version datasets, prompts, models, and scoring code; store lineage.
5. Operator reality: Include messy artifacts (OCR noise, truncated emails, tables, redactions) to avoid “clean lab” bias.
6. Statistical rigor: Define effect sizes, power, and confidence intervals before testing.
7. Safety and ethics: Bake in policy tests, PII/PHI checks, fairness audits, and harm reviews.
8. Cost and latency: Treat efficiency as a first‑class metric alongside quality and safety.
9. Evolvability: Plan for periodic refresh and back‑compat evaluation; maintain “evergreen” and “frozen” tracks.
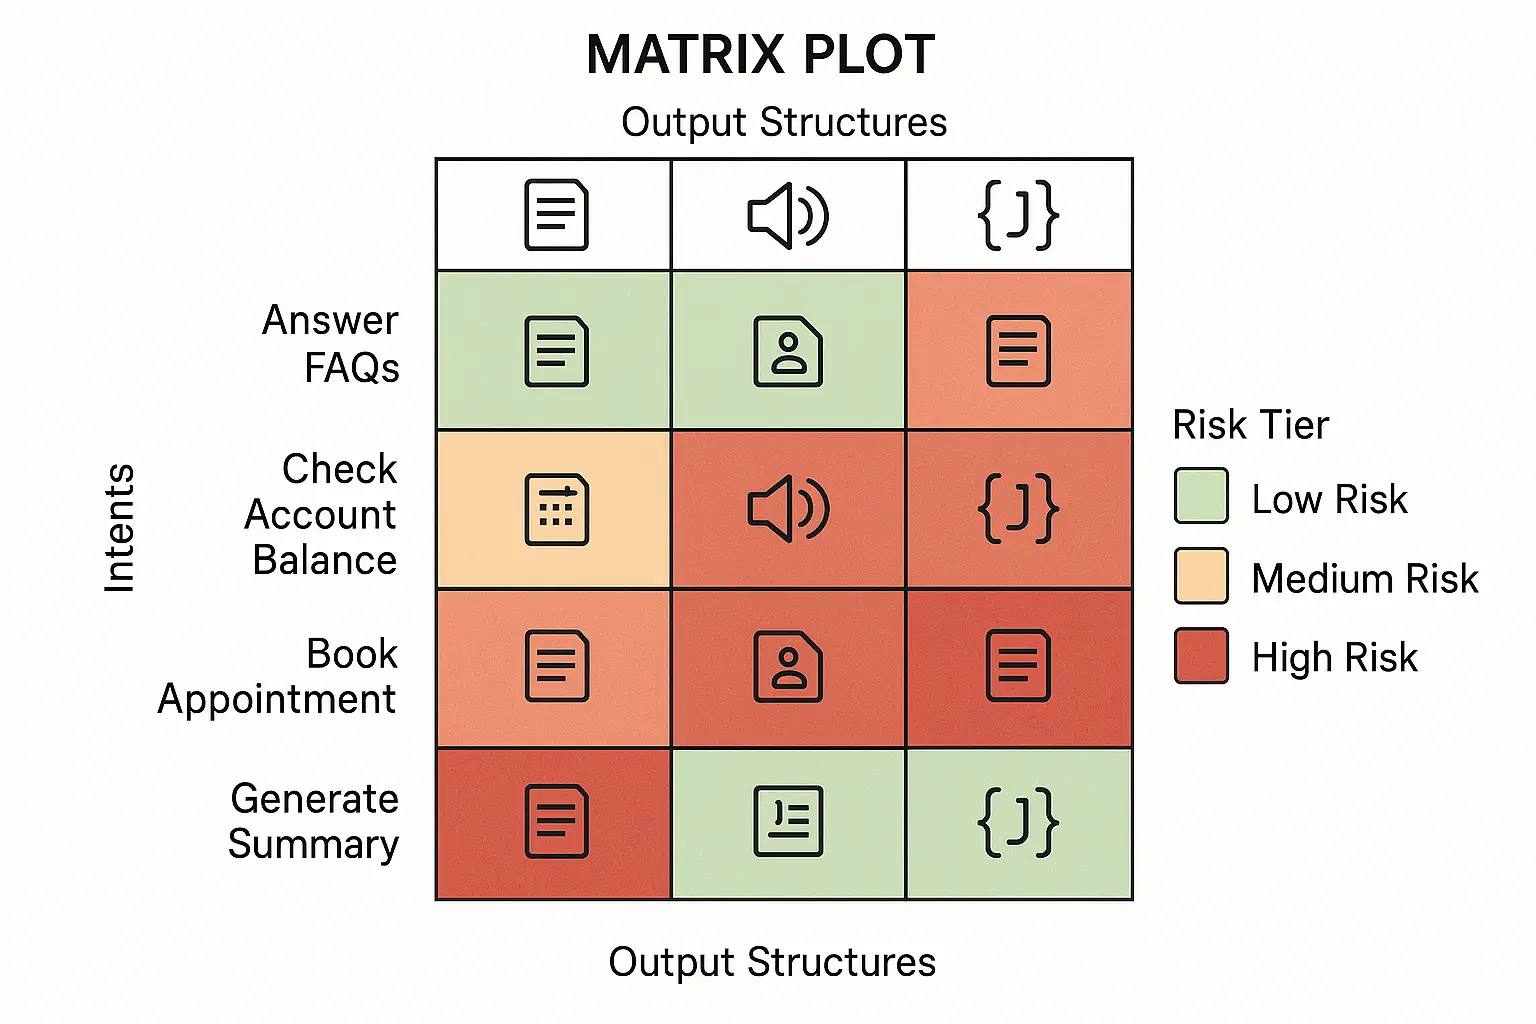
Taxonomy of Tasks and Modalities
Intents
- -Extraction: field/value or table extraction from text, forms, or images.
- -Classification: labeling documents, clauses, emails, or images (multi‑class, multi‑label).
- -Answering: closed‑book QA, RAG‑grounded QA with required citations.
- -Summarization: abstract, bullet, or structured summaries tailored to persona and policy.
- -Decision support: recommend actions with constraints (budget limits, policy checks).
- -Tool‑use tasks: calculator, database lookup, search, or workflow orchestration via function calls.
- -Reasoning: multi‑step program‑ or chain‑of‑thought with verifiable intermediate states.
Modalities
- -Text‑only, vision‑text (scanned PDFs, photos of receipts), tables/structured data, audio (voicemail), multimodal (screen images + text).
Output Structures
- -Free text, templated text, JSON/CSV per schema, evidence tables (doc_id, span, confidence), SQL queries, or action plans.
Risk Tiers
- -Low: stylistic tasks; minimal harm if wrong.
- -Medium: internal analysis; moderate cost of errors.
- -High: compliance, finance, healthcare, or customer‑facing actions; strict guardrails and HITL required.
Sourcing, Sampling, and Privacy
Data Sources
- -Historical tickets/emails, knowledge bases, PDFs/Office docs, forms and EDI, logs, CRM/ERP exports, webpages, and scans/photos from field ops core data sources used in custom AI development.
Sampling Strategy
- -Stratified sampling by cohorts (doc type, date/season, language, scan quality, jurisdiction).
- -Temporal splits to simulate production drift (train/eval by month or quarter).
- -Hard negatives and look‑alikes to probe disambiguation.
- -Edge cases: incomplete or conflicting evidence; synthetic counterfactuals.
Privacy and Legal
- -Data minimization; purpose binding; DLP scans; hashing or tokenization of identifiers.
- -Synthetic replacements for sensitive spans with semantic preservation.
- -Legal reviews; data processing agreements; region constraints.
Annotation, Gold Standards, and Rubrics
Annotation Schemas
- -Define field dictionaries (name, type, format/regex, allowed values, nullability, evidence requirement).
- -For QA/summarization, define rubrics with criteria (coverage, correctness, specificity, style adherence) and scoring (Likert or binary per criterion).
Workforce and Tools
- -Mixed pools: domain experts for high‑risk items, trained raters for routine labels.
- -Annotation UI: evidence highlighting, span offsets, rationale capture, inter‑rater feedback.
Quality Control
- -Inter‑rater reliability (Cohen’s κ or Krippendorff’s α) targets; disagreement adjudication.
- -Gold seeding: hidden gold items to estimate rater quality.
- -Consensus protocols: majority or expert‑tie‑breakers.

Scoring and Metrics
Core Metrics
- -Extraction: precision/recall/F1 at field level; exact/partial match; normalized edit distance; schema validity.
- -Classification: accuracy, macro/micro F1, AUROC/PR, calibration (ECE/Brier).
- -QA/RAG: exact match or span F1; citation precision/recall; evidence coverage (fraction of claims entailed by sources).
- -Summarization: rubric scores (coverage, correctness, specificity), groundedness, and consistency with evidence.
Efficiency and Reliability
- -p50/p95/p99 latency by stage (retrieve, rerank, generate, verify); token burn; cache hit rates; availability.
Safety and Policy
- -Policy violation rate (content, privacy, compliance); abstention correctness (refusal when evidence missing); jailbreak resilience.
Cost
- -Per‑item cost (inference + retrieval + tools); cost per accepted artifact (accounts for rework/HITL); variance.
Aggregate Scores
- -Weighted composites reflecting business priorities: Score = w_q*Quality + w_s*Safety + w_e*Efficiency + w_c*Cost with transparent weights.
Statistical Design: Power, Confidence, and Sequential Tests
Effect Sizes and Power
- -Define minimum detectable effect (MDE) (e.g., +3 points macro‑F1). Use stratified power analyses per cohort.
Confidence Intervals
- -Bootstrap CIs for F1; exact Clopper–Pearson for proportions (violation rate); delta‑method for cost ratios.
Sequential Testing and α Control
- -α‑spending for weekly evaluations; sequential probability ratio tests (SPRT) for canaries; Benjamini–Hochberg for multiple metrics.
Equivalence and Non‑Inferiority
- -When replacing a baseline, test non‑inferiority on safety while pursuing superiority on quality/cost.

Difficulty Calibration and Item Response
- -Tag items by difficulty using rater notes, model scores, and error types.
- -Use Item Response Theory (IRT) or logistic curves to model item difficulty and discrimination; balance sets across easy/medium/hard.
- -Maintain “challenge ladders” for progressive stress testing.
Robustness: Stress, Adversarial, and OOD
- -Noise injections: OCR distortions, typos, formatting chaos, table shuffles.
- -Policy attacks: prompt injection in retrieved content; adversarial instructions.
- -Out‑of‑distribution (OOD): new templates, unseen vendors/products, new regulations.
- -Resource stress: token limits, tool timeouts, rate limits; evaluate degradation modes.
Special Considerations for RAG and Tool‑Use
RAG
- -AI visual inspection systems for industrial automation require similar reporting of retrieval metrics (Recall@k, nDCG, coverage by source/age), index freshness, and evidence alignment.
- -Enforce cite‑before‑say; fail closed (refuse) when no evidence.
Tool‑use and Agents
- -Autonomous AI agents for enterprise workflows require scoring of tool correctness, idempotency, and side‑effect safety; include dry‑run traces.
- -Evaluate planner/critic policies; impose budget guards (max steps/tokens/cost).

Fairness, Bias, and Safety Audits
- -Define sensitive attributes relevant to domain (jurisdiction, language, demographic proxies where lawful).
- -Compare quality and abstention across cohorts; compute equalized odds or opportunity where appropriate.
- -Perform counterfactual evaluation (swap names, locations); track disparate impact.
- -Document known limitations and mitigation strategies; establish incident playbooks.
Governance, Provenance, and Audit
- -Dataset registry: immutable IDs, semantic versions, changelogs, license metadata.
- -Lineage: link challenge items to sources, de‑identification steps, annotators, and adjudication.
- -Access control: per‑tenant or per‑project scope; export logs for eDiscovery.
- -Review cycles: quarterly reviews; red‑team exercises; bias/safety audits.

Tooling and Infrastructure
- -Reproducible evaluation harness with containerized runners; seed control; CPU/GPU profiles.
- -Prompt and policy registries; test suites; CI gates.
- -Scoring library with parsers for JSON, tables, evidence tables; validators; CI integration.
- -Dashboards for metrics with cohort filters; export to PDF/CSV.
Benchmark Lifecycle: Evergreen vs. Frozen Tracks
- -Frozen tracks for longitudinal comparisons and publications; change only with major version bumps.
- -Evergreen tracks that incorporate new templates, regulations, or products; require back‑compat suites.
- -Retire stale items; archive with lineage; keep diffable releases.
Case Studies
Legal Contract Intelligence
- -Built a 2,800‑item challenge set across NDAs, MSAs, DPAs; cohorts by scan quality and jurisdiction. Introduced RAG with cite‑before‑say and JSON‑constrained extraction.
-Outcomes:
macro‑F1 ↑ from 0.76 → 0.91; evidence coverage 99.2%; p95 latency held under 4.0 s with reranking cascade; reduced reviewer rework by 41%. These results demonstrate the power of generative AI systems and enterprise AI innovation.
Customer Support Copilot
- -3,500 emails/tickets across 12 intents; personas and tone guides; policy checks for disallowed promises.
-Outcomes:
deflection +18%; policy violations ↓ 87%; AHT −22%; variance in cost per case −35%. These improvements showcase predictive analytics for enterprise intelligence in action.
Healthcare Summarization
-Mixed notes and labs; strict PHI redaction and safety prompts; rubric‑graded summaries with NLI critics.
-Outcomes:
rubric score +0.7 on 5‑point scale; hallucinations −80%; abstention correctness improved via evidence gating. This follows an AI transformation roadmap for enterprise organisations.
Implementation Blueprint (Pseudo‑Code)
struct Item { id, cohort, task, input, output_schema, gold, evidence, risk }
struct Result { item_id, model_id, pred, evidence, metrics{}, cost, latency }

function evaluate(run, items):
  for item in items:
    prompt <- build_prompt(item)
    pred <- run_system(prompt, constraints=item.output_schema)
    ev <- collect_evidence(pred)
    m <- score(item, pred, ev)
    log(Result(item.id, run.model_id, pred, ev, m, cost=estimate_cost(),
        latency=measure_latency()))
  return aggregate_metrics(run)

function score(item, pred, ev):
  if item.task == 'extraction':
     return f1_fields(item.gold, pred), schema_valid(pred)
  if item.task == 'qa_rag':
     return {em: em(pred, item.gold), cite_prec: cite_precision(ev, item.gold),
            cite_rec: cite_recall(ev, item.gold)}
  if item.task == 'summarization':
     return rubric_score(pred, item.gold, rubric=item.rubric)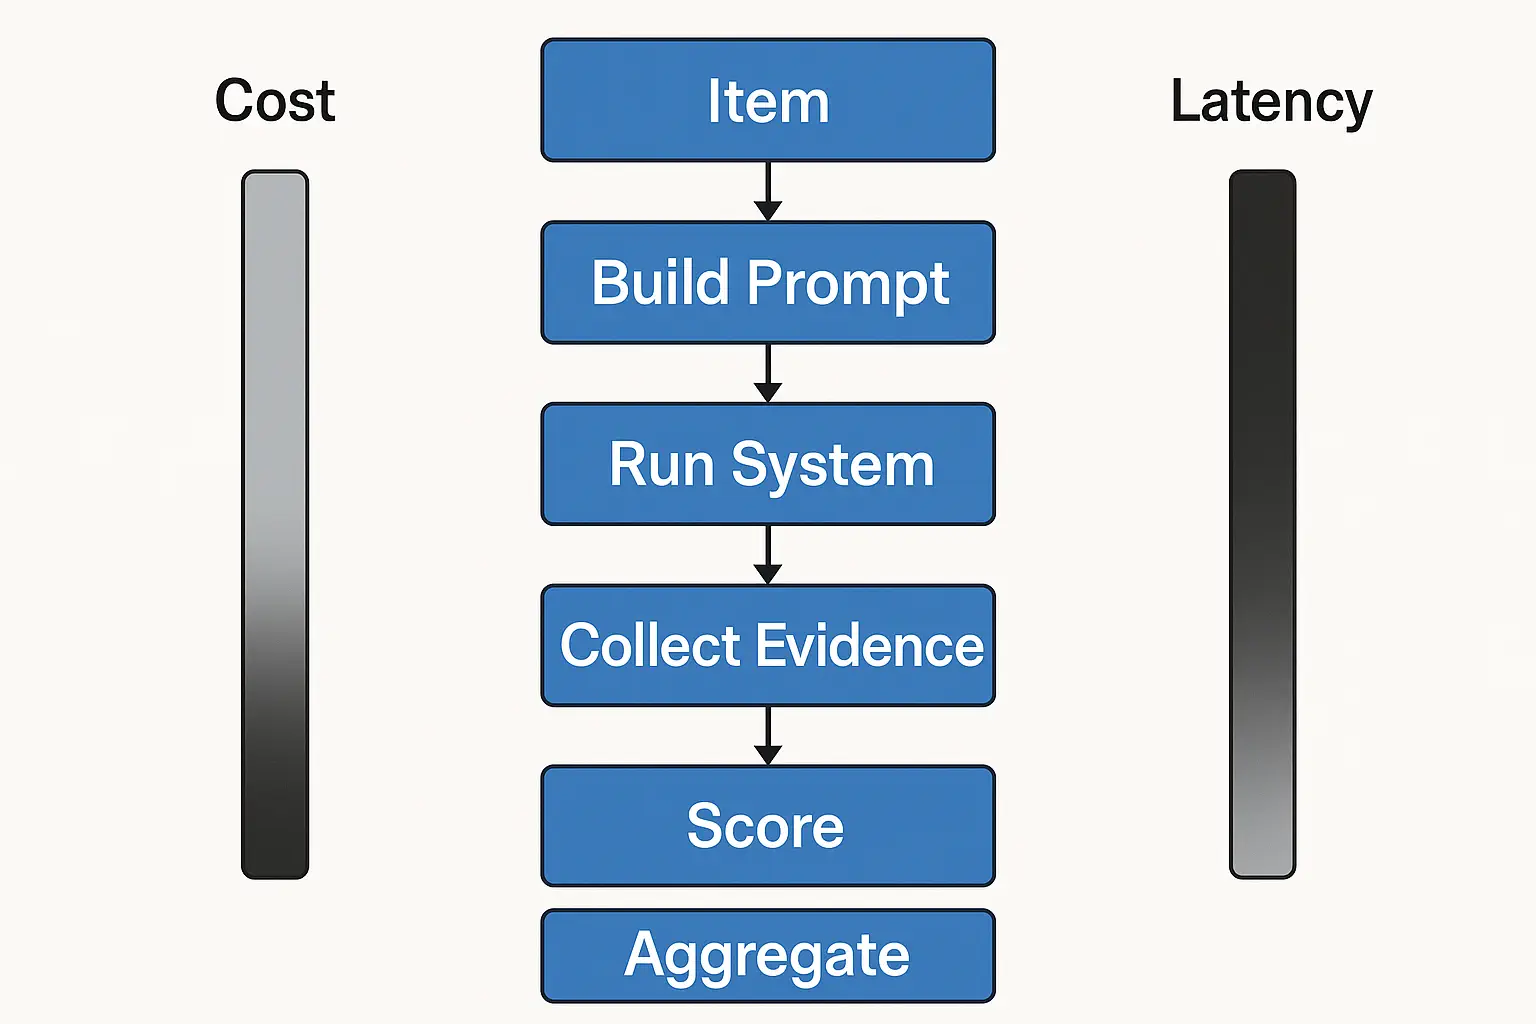
Checklists and Templates
Dataset Design Checklist
- -Map each task to a user story and acceptance criteria.
- -Define cohorts and sampling quotas.
- -Draft schemas/rubrics; create annotation guidelines with examples.
- -Establish privacy and DLP rules; de‑identify as needed.
- -Plan frozen vs. evergreen tracks; set update cadence.
Annotation Checklist
- -Train raters; run calibration round; set κ/α targets.
- -Build evidence‑linking UI; capture rationales.
- -Seed gold items; monitor rater drift; adjudicate disagreements.
Evaluation Checklist
- -Define MDE and power; compute sample sizes per cohort.
- -Implement scoring library with validators and CI tests.
- -Configure dashboards with cohort filters; publish CIs and burn‑rate alerts.
Operating with Challenge Sets: From Pilot to Governance
- -Release gates: block deploys on regression beyond tolerance in any high‑risk cohort; require sign‑off from product, security, and compliance.
- -Error budget policies: allocate violation budgets for safety and SLA metrics; freeze rollouts if burn‑rate exceeds thresholds.
- -Audit and reporting: quarterly reports to risk committees; evidence of lineage and mitigations.
- -Vendor management: require partners to evaluate on your challenge sets; compare on both frozen and evergreen tracks.
Discussion: Pitfalls and Antipatterns
- -Overfitting to the benchmark: rotate evergreen track; maintain blind holdouts; audit for “teaching to the test.”
- -Siloed ownership: create cross‑functional Evaluation Council; publish roadmaps and diffs.
- -Metric monoculture: combine automated metrics with human rubrics and business outcomes.
- -Ignoring costs: track p95 cost per item and variance; design tests for cost regressions.
- -Silent prompt/policy changes: require registry and diffs; add prompt linting and unit tests. Ready to build a robust benchmarking strategy? Schedule an enterprise AI strategy consultation with our team.
Future Directions
- -Program‑of‑thought benchmarks with executable intermediate steps and formal verifiers.
- -Causal evaluation to quantify the value of retrieval vs. model scaling.
- -Federated challenge sets: cross‑org collaboration without raw data sharing; secure aggregation of metrics.
- -Automatic item generation with human vetting to expand coverage while reducing manual effort.
- -Safety attestations embedded in artifacts (proof‑carrying prompts/models) for verifiable compliance.
Conclusion
Domain‑specific challenge sets transform evaluation from a subjective demo ritual into a disciplined, auditable process that aligns with business value, safety, and cost realities. By following the principles, taxonomies, and procedures presented here-grounded metrics, rigorous annotation, cohort‑aware sampling, robust statistics, and governance-organizations can make reliable release decisions, negotiate SLAs with confidence, and continuously improve their custom AI systems. The challenge set becomes a shared contract among engineering, product, risk, and operations, turning progress into something measurable, reproducible, and trustworthy.
References
- Liang, P., Bommasani, R., Lee, T., Tsipras, D., Soylu, D., Yasunaga, M., ... & Koreeda, Y. (2022). Holistic evaluation of language models. arXiv preprint arXiv:2211.09110.[ieee]
- Lewis, P., Perez, E., Piktus, A., Petroni, F., Karpukhin, V., Goyal, N., ... & Kiela, D. (2020). Retrieval-augmented generation for knowledge-intensive nlp tasks. Advances in neural information processing systems, 33, 9459-9474.[neurips]
- Gebru, T., Morgenstern, J., Vecchione, B., Vaughan, J. W., Wallach, H., Iii, H. D., & Crawford, K. (2021). Datasheets for datasets. Communications of the ACM, 64(12), 86-92.[acm]
- Wang, C. (2023). Calibration in deep learning: A survey of the state-of-the-art. arXiv preprint arXiv:2308.01222.[arxiv]
- Biyani, P., Bajpai, Y., Radhakrishna, A., Soares, G., & Gulwani, S. (2024, July). Rubicon: Rubric-based evaluation of domain-specific human ai conversations. In Proceedings of the 1st ACM International Conference on AI-Powered Software (pp. 161-169).[acm]