
The Downtime Debt Nobody Talks About
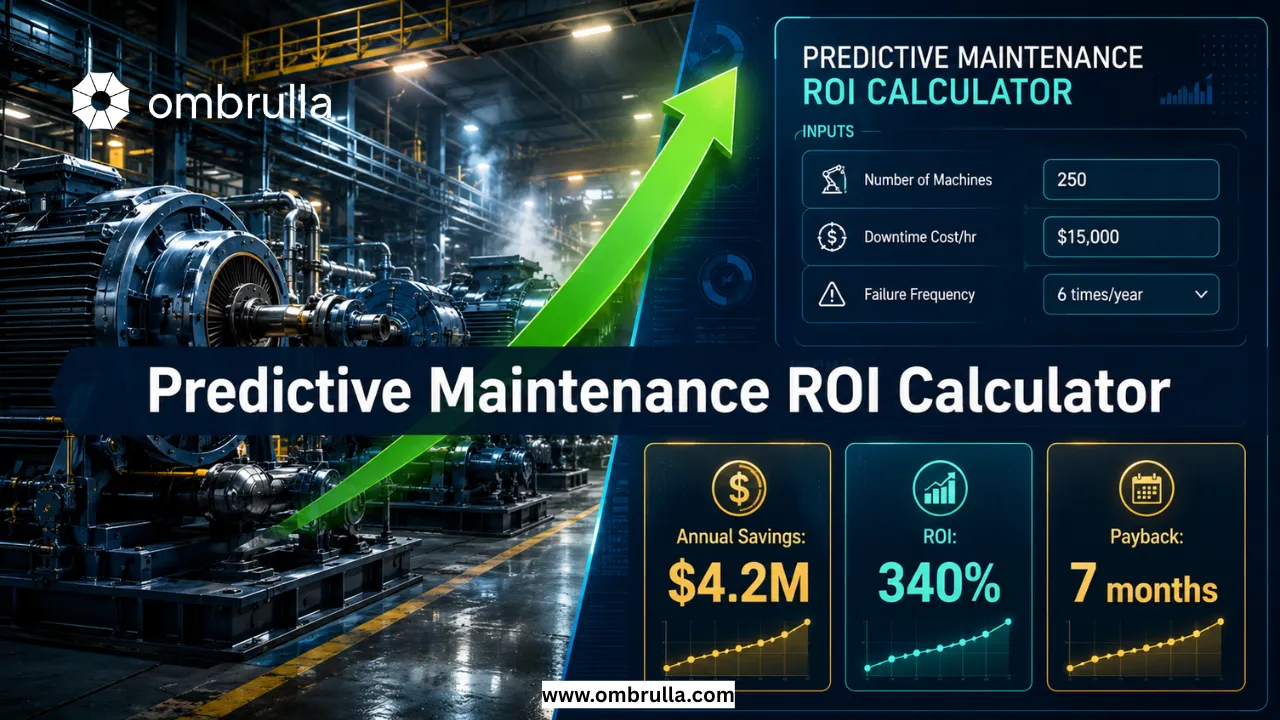
Unplanned downtime is not just a maintenance issue - it is a financial leak that silently reduces production capacity, margin, customer commitments, and asset reliability. For industrial manufacturers, every unexpected equipment failure can convert directly into lost output, emergency repair cost, overtime labour, quality risk, and delayed delivery. A predictive maintenance ROI calculator helps leaders move beyond assumptions and quantify the real business value of early failure detection, condition monitoring, and planned intervention.

The frustrating part is that most organisations already suspect predictive maintenance (PdM) would help. The sensors exist. The AI platforms exist. The case studies exist. What is often missing is a clear, defensible answer to the question that every CFO, operations director, or plant manager will ask before signing off on any new investment: What is the return on investment? And when do we see it?
This article exists to answer that question precisely. We break down the eight key inputs that determine your PdM ROI, walk through a fully worked calculation example, explain each output metric in plain language, and give you the framework to identify which assets should be prioritised in a pilot programme. Whether you are building a business case for a board presentation or simply stress-testing a vendor's ROI claim, this is the reference you need.
If you are tasked with driving efficiency, reducing downtime, and scaling technology in heavy industry, yes. This guide is specifically crafted for:
• The Decision Makers: Plant Managers & Operations VPs
• The Execution Leaders: Maintenance Directors
• The Innovators: Digital Transformation Leaders
Applicable Industries: Manufacturing | Oil & Gas | Utilities | Food & Beverage | Water & Process Industries
The PdM ROI Core Framework: The 8 Critical Inputs
The following eight variables form the complete input set for a rigorous PdM ROI calculation. Understanding each input, what it represents, how to gather it accurately, and what to watch for, is essential for producing a credible business case.
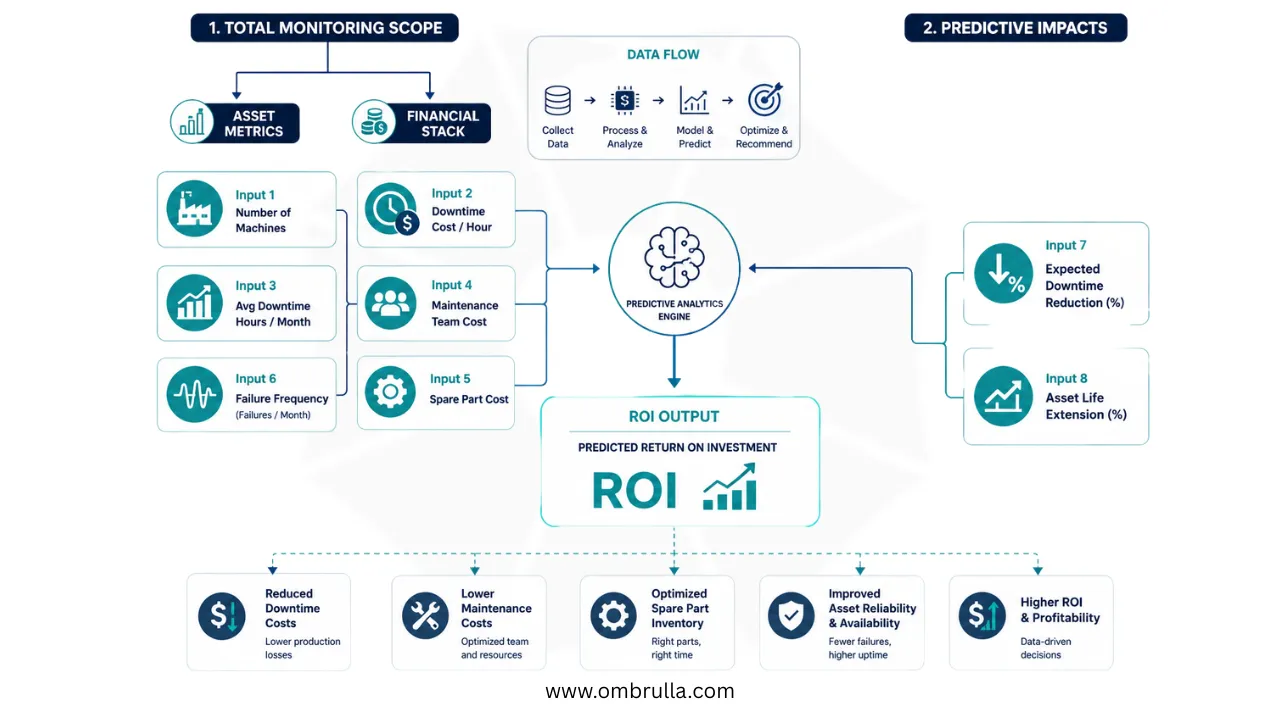
1. Asset & Operational Baseline
Input 1: Number of Machines
- - Definition: The exact scope of the PdM deployment-the total count of assets actively being monitored. While more machines increase sensor and platform costs, they exponentially scale aggregate savings potential.
- - Data Gathering Tip: Extract your asset register from your CMMS or ERP. For a pilot phase ROI, restrict this count strictly to the specific asset class being monitored (e.g., only compressors at Site A) rather than the full enterprise population to keep the business case defensible.
Input 3: Average Downtime Hours Per Month
- - Definition: The baseline duration of operational stoppages. This must capture both complete production halts and partial-capacity events, which are often invisible in headline metrics but massive in aggregate.
- - Data Gathering Tip: Pull a 12-month history from your CMMS to smooth out seasonal variations. If your system merges repair time with downtime, cross-reference shift logs, production reports, or manually timed historical incidents.
Input 6: Failure Frequency (Failures Per Month)
- - Definition: The total number of significant failures-those causing measurable downtime or production loss-across the monitored population.
- - Data Gathering Tip: Categorize failures into known causes (bearing wear, seal degradation, lubrication failure) vs. unknown causes. Focus your ROI projections primarily on the known causes, as these represent the predictable failure modes that sensors and AI models can actually learn to anticipate.
2. Financial Cost Stack
| Input Variable | What Full Cost Optimization Includes | The Hidden Traps & Industry Benchmarks |
|---|---|---|
| Input 2: Downtime Cost Per Hour (£ / $) | • Lost production revenue • Idle labor costs • Secondary equipment starvation • SLA/contractual penalties • Emergency response fees | The Trap: Relying only on lost production revenue understates true downtime costs by 30–60%. You must build a comprehensive cost stack for a credible business case. |
| Input 4: Maintenance Team Cost Per Month (£ / $) | • Fully loaded salaries & benefits • Overtime premiums • Contract labor • Shared service allocations | The Reality: PdM rarely reduces headcount. Instead, it reallocates time from reactive firefighting to planned work, allowing the same team to manage more assets or higher-value tasks. |
| Input 5: Spare Part Cost Per Month (£ / $) | • Emergency procurement premiums • Buffer stock carrying costs • Obsolescence write-offs • Urgent logistics charges | The Benchmark: Reactive operations carry 15–25% higher part costs. PdM enables Just-In-Time (JIT) procurement aligned to forecast failure windows, slashing inventory holding costs. |
3. Predictive Impact Projections
Input 7: Expected Downtime Reduction (%)
- - Definition: The percentage of current downtime that the PdM program is expected to eliminate via early warnings and scheduled interventions.
- - Strategy: While vendor best-case claims boast higher numbers, use a conservative 25–30% as your initial defensible baseline for the business case.
Input 8: Expected Asset Life Extension (%)
- - Definition: The extension of the operational life of capital assets achieved by catching degradation early and mitigating fatigue damage accumulation.
- - Strategy: For long-lived assets (30+ year design life), even a modest 10% extension defers millions in capital expenditure (CapEx), significantly boosting the long-term Net Present Value (NPV) of your PdM investment.
Worked Example: The ROI Calculator in Action
To make the calculator framework concrete, let us walk through a realistic worked example based on a mid-sized automotive components manufacturer operating three production shifts across 45 CNC machining centres and press lines.
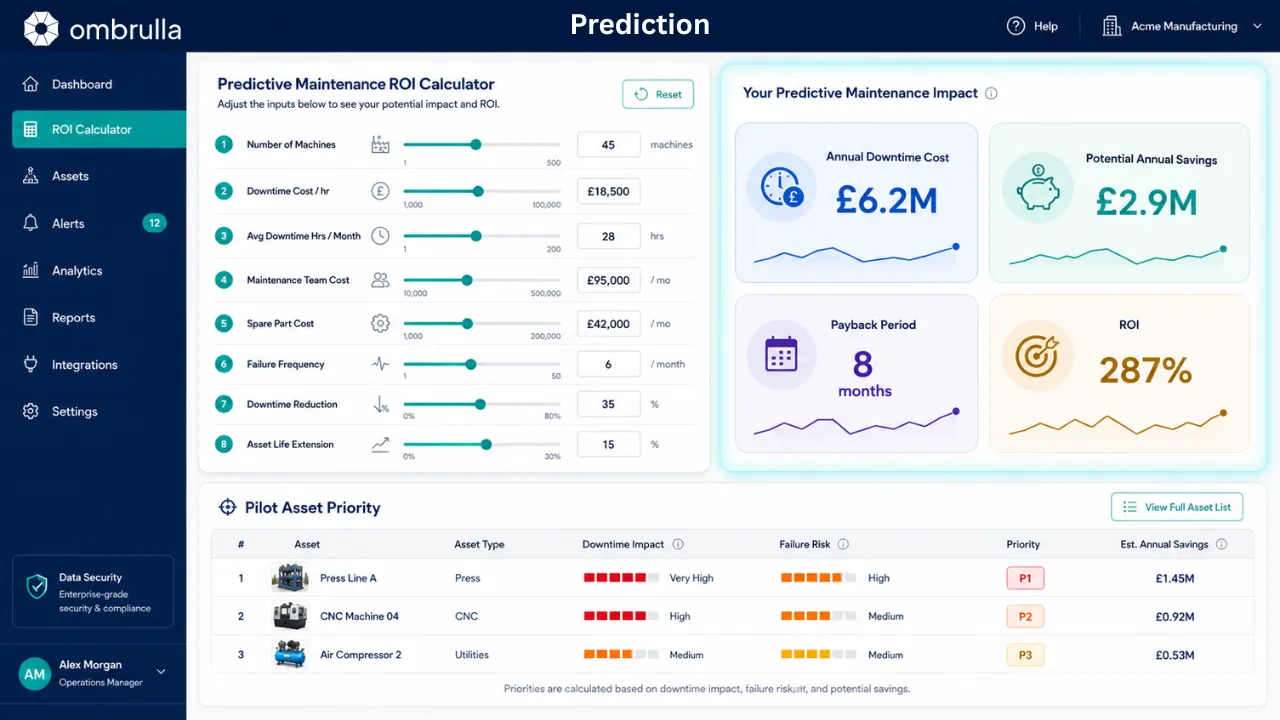
Scenario: Apex Precision Components Ltd.
| Input Variable | Value Entered | Source |
|---|---|---|
| Number of machines | 45 assets | CMMS asset register |
| Downtime cost per hour | £18,500/hr | Finance + ops calculation |
| Average downtime hours per month | 28 hours | 12-month CMMS average |
| Maintenance team cost per month | £95,000/mo | HR payroll + contracts |
| Spare part cost per month | £42,000/mo | Procurement records |
| Failure frequency | 6 failures/month | Work order history |
| Expected downtime reduction | 35% | Conservative benchmark |
| Expected asset life extension | 15% | Equipment OEM data |
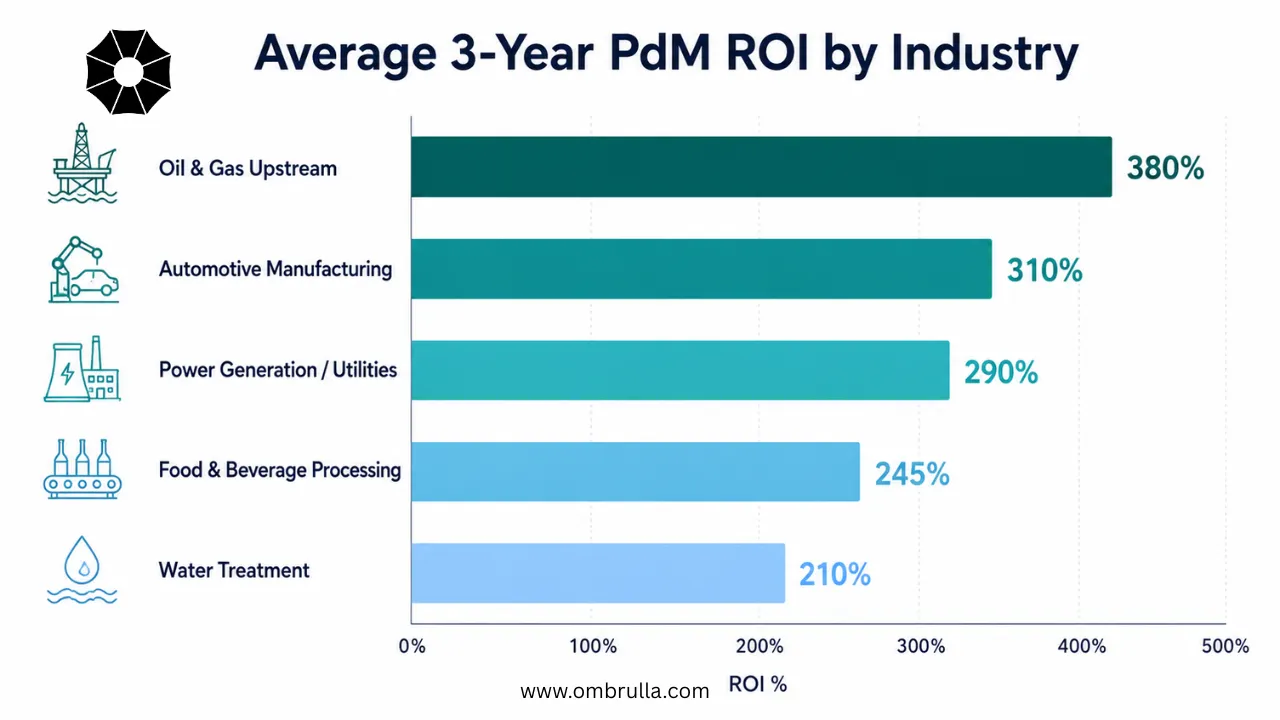
Industry Benchmark Data - What Good ROI Looks Like
Benchmarking your calculated ROI against industry peers is an important validation step - both for internal credibility and for pressure-testing your assumptions. The following benchmarks are drawn from published case studies, industry reports from Deloitte, McKinsey, ARC Advisory Group, and Frost & Sullivan, and practitioner experience across multiple sectors.
| Industry | Avg Downtime Cost/Hr | Typical Downtime Reduction | Avg Payback Period | 3-Year ROI Range | Key PdM Use Case |
|---|---|---|---|---|---|
| Oil & Gas Upstream | $150K–$500K | 40–55% | 3–6 months | 300–450% | Compressor, pump, rotating equipment |
| Automotive Manufacturing | £50K–£250K | 30–45% | 6–10 months | 250–380% | Press lines, welding robots, CNC |
| Power Generation / Utilities | $80K–$300K | 35–50% | 6–12 months | 220–340% | Turbines, generators, transformers |
| Food & Beverage Processing | £25K–£80K | 25–40% | 9–14 months | 180–280% | Fillers, packaging lines, refrigeration |
| Water Treatment | £15K–£60K | 25–35% | 10–18 months | 150–240% | Pumps, blowers, UV systems |
These benchmarks illustrate that even the most conservative sector - water treatment - typically delivers 150%+ ROI over three years. The key variable that shifts ROI most dramatically is the downtime cost per hour: the higher the production value of a stopped line, the faster the payback and the higher the total return.
Financial Pitfalls: Protecting Your Business Case Credibility
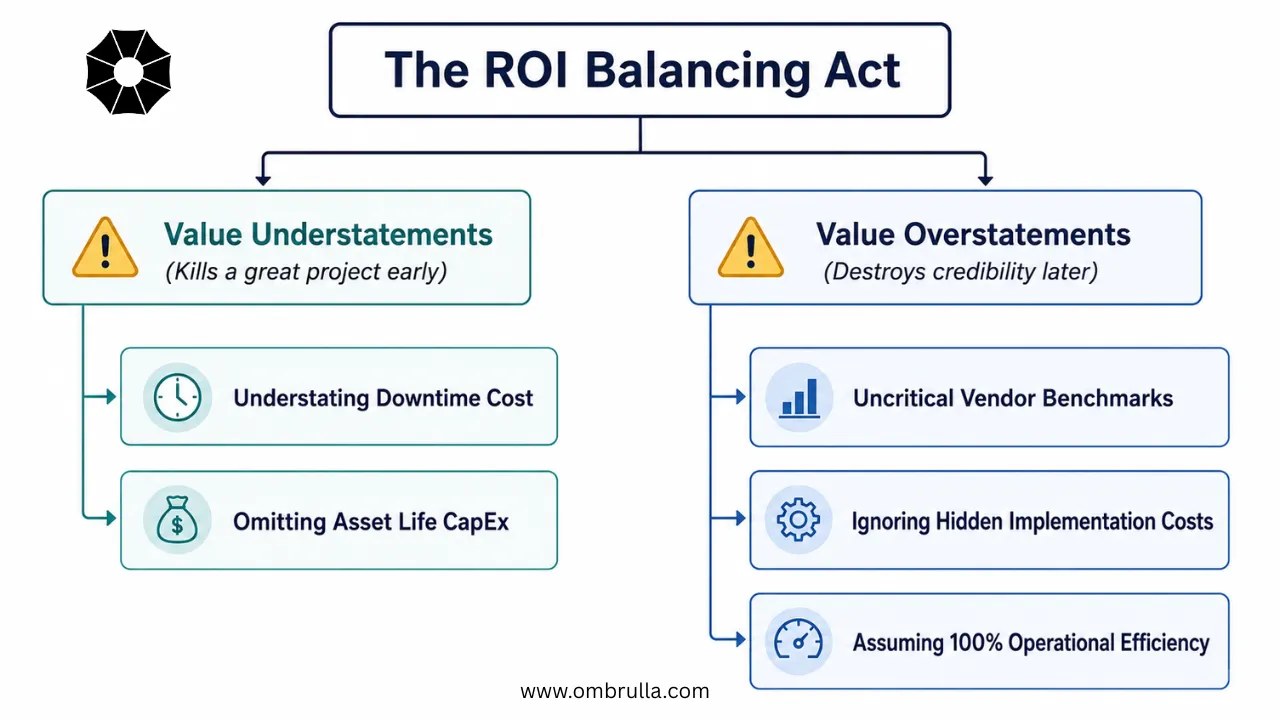
An ROI calculation is only as reliable as its inputs. Errors in your model generally fall into two camps: Value Understatements (which kill viable projects in the boardroom) and Value Overstatements (which destroy professional credibility when actuals fall short).
Category 1: The Understatements (The Hidden Value You’re Missing)
Pitfall 1: Understating True Downtime Cost
- - The Error: Using only lost production revenue in the equation while forgetting idle labor, secondary equipment impact, penalty charges, and emergency response costs.
- - Financial Impact: Routinely understates true downtime costs by 30–60%, making the ROI calculation appear weak when the business case is actually strong.
- - Executive Fix: Build a comprehensive "cost stack" for downtime by working backward from impact. For a critical production line: (1) Calculate the marginal production revenue lost per hour, (2) Add fully-loaded labor costs for all personnel impacted (operators, supervisors, quality checkers standing idle), (3) Quantify secondary process delays and their cost, (4) Include any contractual penalties for missed delivery windows, (5) Factor emergency response premiums. Showing the true, fully loaded cost makes the business case significantly stronger and highly compelling to the board.
Pitfall 5: Neglecting the Asset Life Extension Value
- - The Error: Omitting long-term asset longevity from the business case because it is harder to quantify and realized further in the future.
- - Financial Impact: Leaves massive deferred CapEx off the table, missing out on an automatic 15–25% boost to total ROI.
- - Executive Fix: For capital-intensive assets with six- or seven-figure replacement costs, always include a conservative 10% life extension as a separate line item in your savings calculation. If OEM data suggests 20–30 year asset life, a 10% extension (2–3 additional years) is defensible and conservative. This single adjustment often adds $100k–$500k to your total three-year ROI, pushing a marginal business case into compelling territory.
Category 2: The Overstatements - The Blind Spots That Risk Credibility
Pitfall 2: Relying Uncritically on Vendor-Supplied Benchmarks
- - The Error: Treating vendor marketing case studies as guaranteed baseline realities. Vendor data represents flawless, best-case deployments under ideal conditions - not your operational environment.
- - The Risk: Applying a generic '400% ROI' claim without adjusting for your specific asset criticality, data quality, and organizational readiness is a direct path to missed targets and damaged stakeholder trust.
- - Executive Fix: Treat vendor figures as an absolute ceiling, not a starting baseline. For your business case: (1) Use vendor ROI as a reference, (2) Identify the specific operational conditions in the vendor case, (3) Score your environment against those conditions (asset data quality, team readiness, sensor accessibility), (4) Apply a downward adjustment factor of 0.6–0.8 to vendor metrics, (5) Build your business case on the adjusted figure. This conservative approach builds immediate credibility with finance stakeholders who will respect your analytical rigor.
Pitfall 3: Ignoring Non-Hardware Implementation Costs
- - The Error: Budgeting exclusively for sensor hardware and software licenses while ignoring the ecosystem required to run them.
- - The Cost Blind Spot: First-time buyers frequently underestimate non-hardware costs by 40–60%. A complete budget must include:
1. Edge compute & connectivity infrastructure
2. CMMS/ERP system integration
3. Data engineering, labeling, and model validation
4. Change management, staff training, and ongoing support
Pitfall 4: Assuming 100% of Modeled Savings Are Achievable
- - The Error: Assuming perfect execution where every single alert is caught, interpreted correctly, and actioned instantly by maintenance teams.
- - The Reality: No PdM system eliminates all failures. Sensor limitations, missed alerts, and organizational friction will always exist.
- - Executive Fix: Apply an "Operational Friction Discount" of 15–25% to your modeled savings. Presenting a discounted, highly defensible ROI figure builds immediate trust with finance stakeholders.
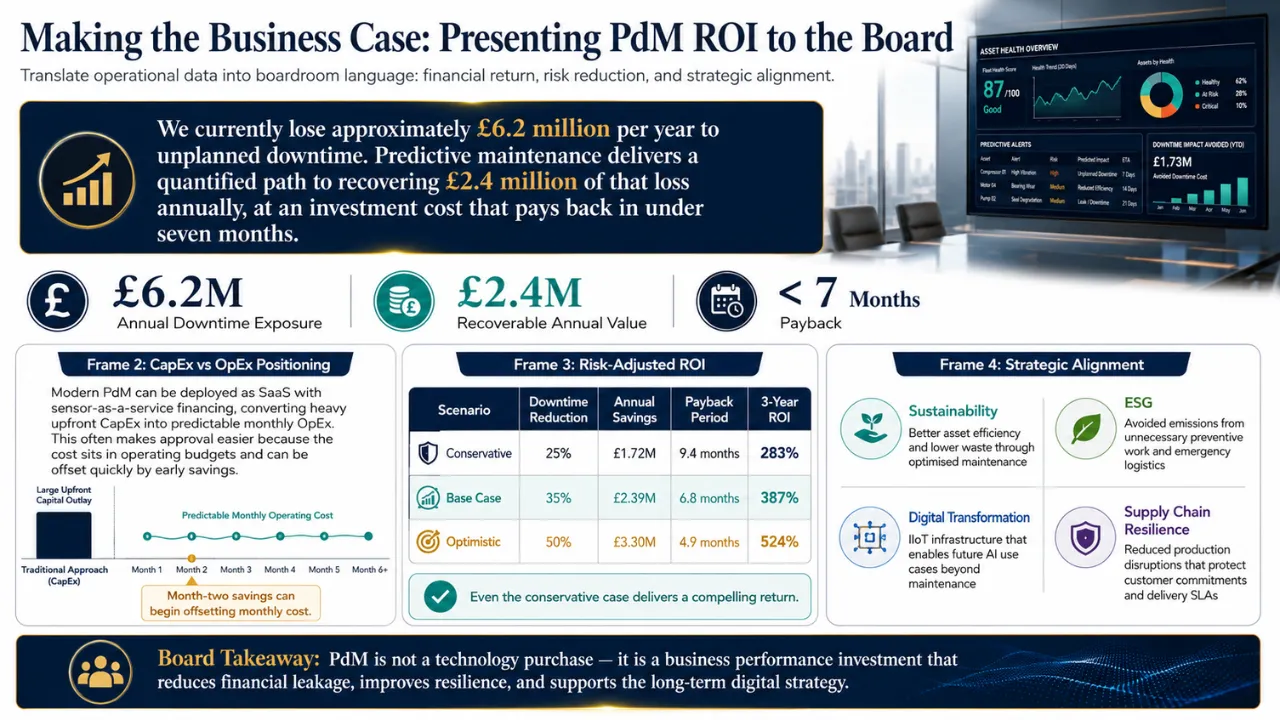
Making the Business Case: Presenting Predictive Maintenance ROI to the Board
Getting a Predictive Maintenance investment approved is not about explaining sensors, AI models, dashboards, or algorithms. It is about converting operational pain into boardroom language: financial return, business risk reduction, and strategic advantage.
For senior executives, PdM becomes compelling when it is positioned as a measurable business recovery program - not as a technology project.
The Boardroom Message
"We currently lose approximately £6.2 million per year due to unplanned downtime. Predictive Maintenance gives us a structured path to recover up to £2.4 million annually, with payback in under seven months and long-term benefits across reliability, sustainability, and operational resilience."
This opening immediately connects PdM to what the board cares about most: cash impact, risk control, and strategic value.
1. Lead with Financial Exposure, Not Technology
The strongest PdM business case starts with the cost of doing nothing.
- - Instead of saying: "We need sensors, AI models, and a predictive maintenance platform."
- - Say: "Unplanned equipment failures are currently creating a £6.2 million annual exposure through lost production, emergency repairs, spare parts escalation, overtime, and delayed customer commitments."
- - Then present PdM as a recovery mechanism: "By reducing downtime by 35%, we can recover approximately £2.39 million per year while improving asset availability and maintenance productivity."
This shifts the discussion from technical adoption to financial recovery.
2. Position PdM as an OpEx-Friendly Investment
Many boards hesitate when a project requires large upfront CapEx. Predictive Maintenance can be positioned more attractively when delivered through:
- - SaaS subscription models
- - Sensor-as-a-service options
- - Phased deployment by critical asset class
- - Monthly operating cost structure
- - Pilot-to-scale investment governance
This means PdM does not need to compete directly with major capital projects. Instead, it becomes a controlled operating investment that can begin generating savings early in the rollout.
Finance-facing message: "The investment can be structured as predictable monthly OpEx, with savings starting from reduced downtime, fewer emergency interventions, and better maintenance planning."
3. Present Risk-Adjusted ROI Scenarios
Boards do not want a single optimistic number. They want to see whether the investment still makes sense under conservative assumptions.
| Scenario | Downtime Reduction | Annual Savings | Payback Period | 3-Year ROI |
|---|---|---|---|---|
| Conservative | 25% | £1.72M | 9.4 months | 283% |
| Base Case | 35% | £2.39M | 6.8 months | 387% |
| Optimistic | 50% | £3.30M | 4.9 months | 524% |
Key Boardroom Takeaway: Even under the conservative scenario, the PdM investment pays back within the first year and delivers a strong three-year return. This builds confidence because the proposal is not dependent on perfect implementation or best-case assumptions.
4. Connect PdM to Strategic Priorities
A high-quality PdM business case should go beyond maintenance savings. It should connect directly to existing board-level priorities.
- - SustainabilityPredictive Maintenance improves energy efficiency by keeping assets operating within healthy performance ranges. It also reduces waste caused by premature part replacement and avoidable equipment damage.
- - ESGBetter maintenance planning reduces emergency logistics, unnecessary preventive work, excess spare usage, and avoidable production losses. This supports more responsible and efficient operations.
- - Digital TransformationPdM creates an IIoT and AI foundation that can later support quality analytics, energy optimisation, safety monitoring, asset lifecycle management, and autonomous operations.
- - Supply Chain ResilienceBy reducing unplanned production stoppages, PdM helps protect customer commitments, delivery SLAs, production schedules, and revenue continuity.
Board-Level Conclusion
Predictive Maintenance should be presented as a business performance initiative, not a maintenance technology upgrade.
The strongest board case is built around one clear message:
"PdM reduces financial leakage, protects production continuity, improves asset reliability, and supports our long-term digital and sustainability roadmap - with payback measured in months, not years."
When framed this way, Predictive Maintenance becomes easier for the board to approve because it speaks directly to financial return, operational risk, and strategic alignment.
Calculate Your PdM ROI - Right Now
Use our free interactive ROI calculator or book a tailored ROI assessment with our AI & IoT specialists.
What you get in a FREE 45-Minute PdM ROI Discovery Workshop:
- →A personalised ROI calculation using your actual asset data and downtime figures
- →Pilot asset priority ranking for your specific facility and asset mix
- →A board-ready one-page ROI summary document you can use immediately