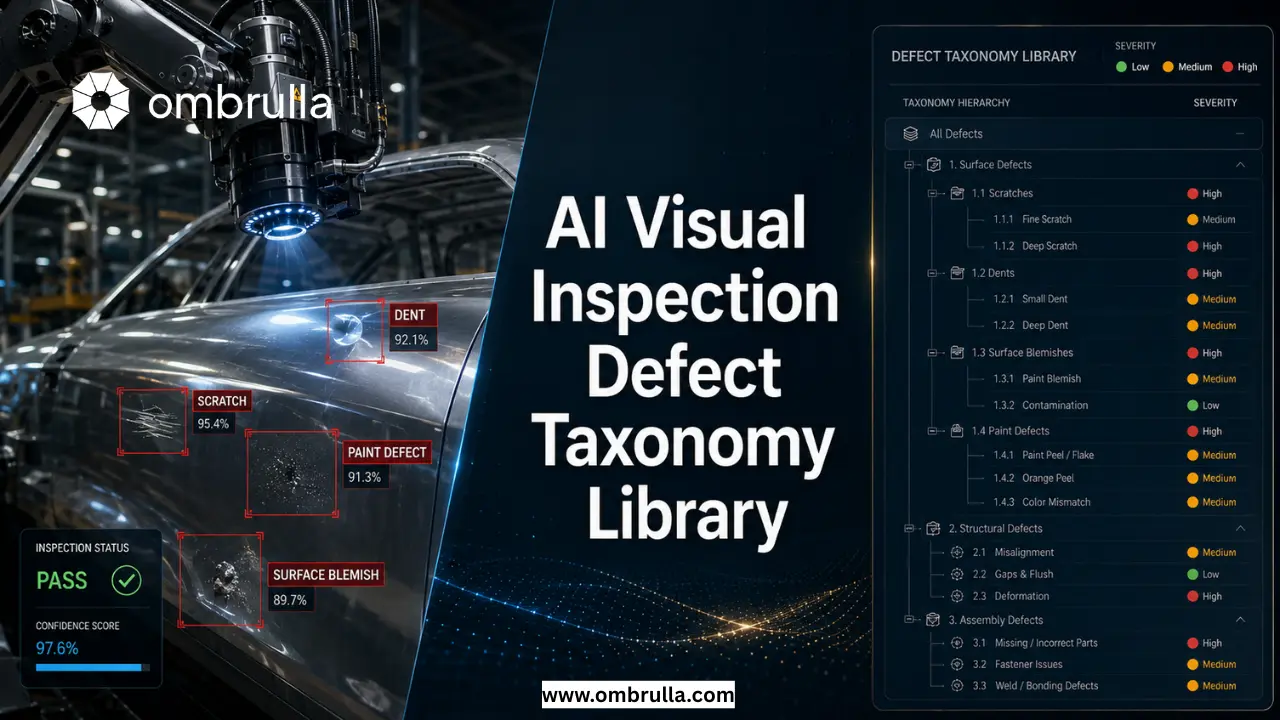

Industry 1: Automotive Defect Taxonomy
The automotive sector demands the highest cosmetic and structural precision of any manufacturing discipline. A single body panel passes through more than twenty quality checkpoints from pressing to final line-off. AI visual inspection in automotive must handle a wide range of defect types across painted surfaces, sub-assemblies, and fully assembled vehicles.
| Defect Type | Sub-Type | Description | Annotation Type | Severity | AI Model Suitability |
|---|---|---|---|---|---|
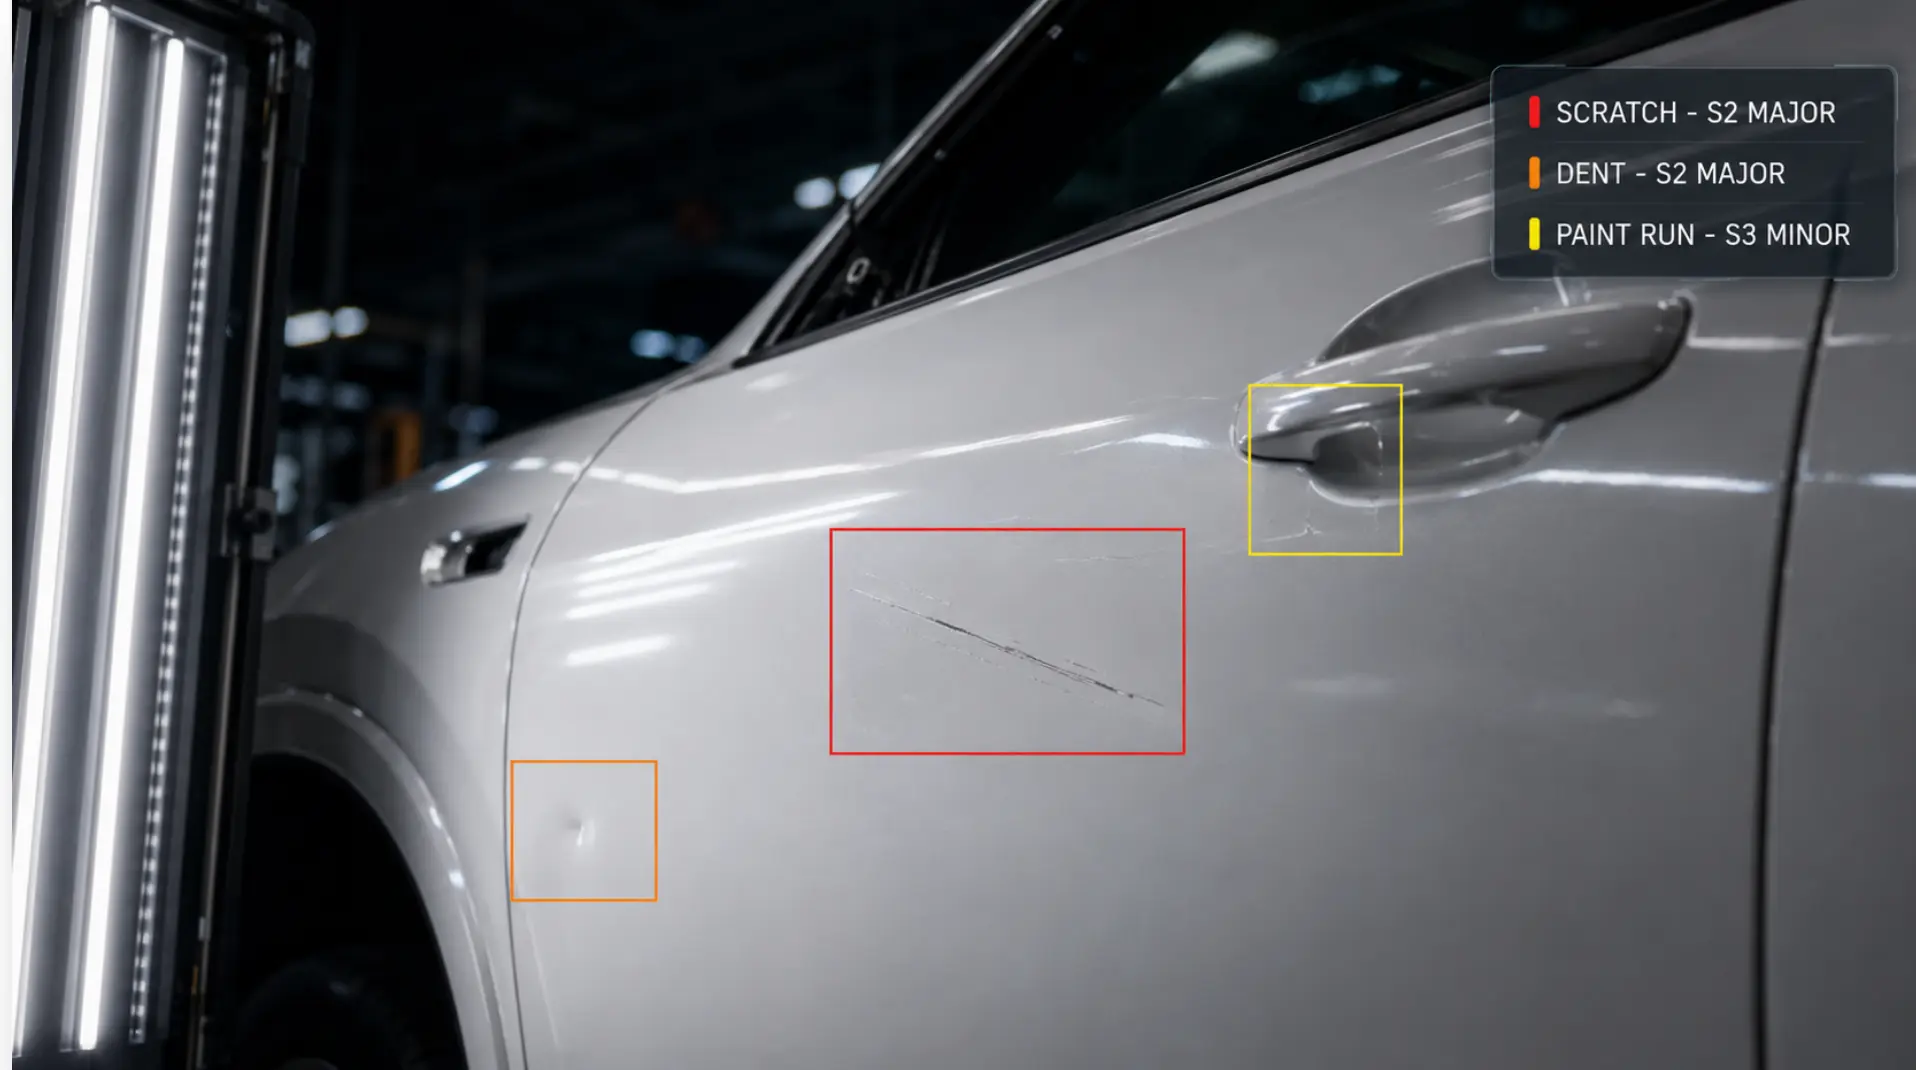
| Scratch | Micro-scratch, deep gouge, keying | Linear surface disruption to clear coat, base coat or metal substrate. | Bounding Box / Polygon | S1–S2 | CNN + High-res camera (4K+) |
| Dent | Panel dent, crease dent, hail damage | Localised deformation of sheet metal causing concave or convex shape deviation. | Polygon + depth map | S1–S2 | 3D point cloud + CNN |
| Paint Defect | Run, orange peel, fish-eye, blister, overspray | Imperfections in the paint layer affecting finish, adhesion or appearance. | Bounding Box / Semantic mask | S2–S3 | ResNet / EfficientDet under raking light |
| Assembly Mismatch | Panel gap variance, flush misalignment, clip misfit | Incorrect spatial relationship between assembled components exceeding tolerance specification. | Keypoint / Measurement overlay | S1–S2 | Keypoint detection + metrology AI |
| Missing Parts | Absent fastener, missing trim, absent sensor | Required component absent from its specified location on the assembly. | Classification / Presence detection | S1 | YOLO object detection (presence/absence) |
Automotive Annotation Guidelines
- - Scratches and DentsUse tight bounding boxes that fit the defect perimeter within 5 pixels on each side.
- - Paint DefectsFor paint defects with irregular boundaries, use polygon annotation with a minimum of 8 anchor points.
- - Assembly MismatchUse keypoint annotations at the gap's two opposing edges, with a measured pixel distance recorded in metadata.
- - Missing PartsMark the expected location with a centred bounding box labelled with the absent component's part code.
- - Required MetadataAll automotive annotations must carry: (a) defect class, (b) severity code, (c) camera station ID, (d) part number, (e) timestamp.
AI Model Note – Automotive Paint Inspection
For automotive paint AI defect detection, raking-light camera setups deliver better accuracy than diffuse-light setups, with typical mAP improvement of 18–24%.
A dual-lighting inspection rig is recommended, alternating between:
| Lighting Type | Purpose |
|---|---|
| Diffuse Light | Captures colour and surface consistency. |
| Raking Light | Highlights scratches, dents, waviness, and micro-defects. |
For high-speed production lines running at 60+ parts per minute, YOLOv8 or RT-DETR models are well-suited for real-time defect detection and quality alerts.
Industry 2: Manufacturing Defect Taxonomy
In discrete and process manufacturing environments – from metal fabrication and injection moulding to PCB assembly and pharmaceutical packaging – defects can originate from raw material inconsistencies, tooling wear, process drift, or environmental contamination. The defect taxonomy must be granular enough to enable root cause correlation.
| Defect Type | Sub-Type | Description | Annotation Type | Severity | AI Model Suitability |
|---|---|---|---|---|---|
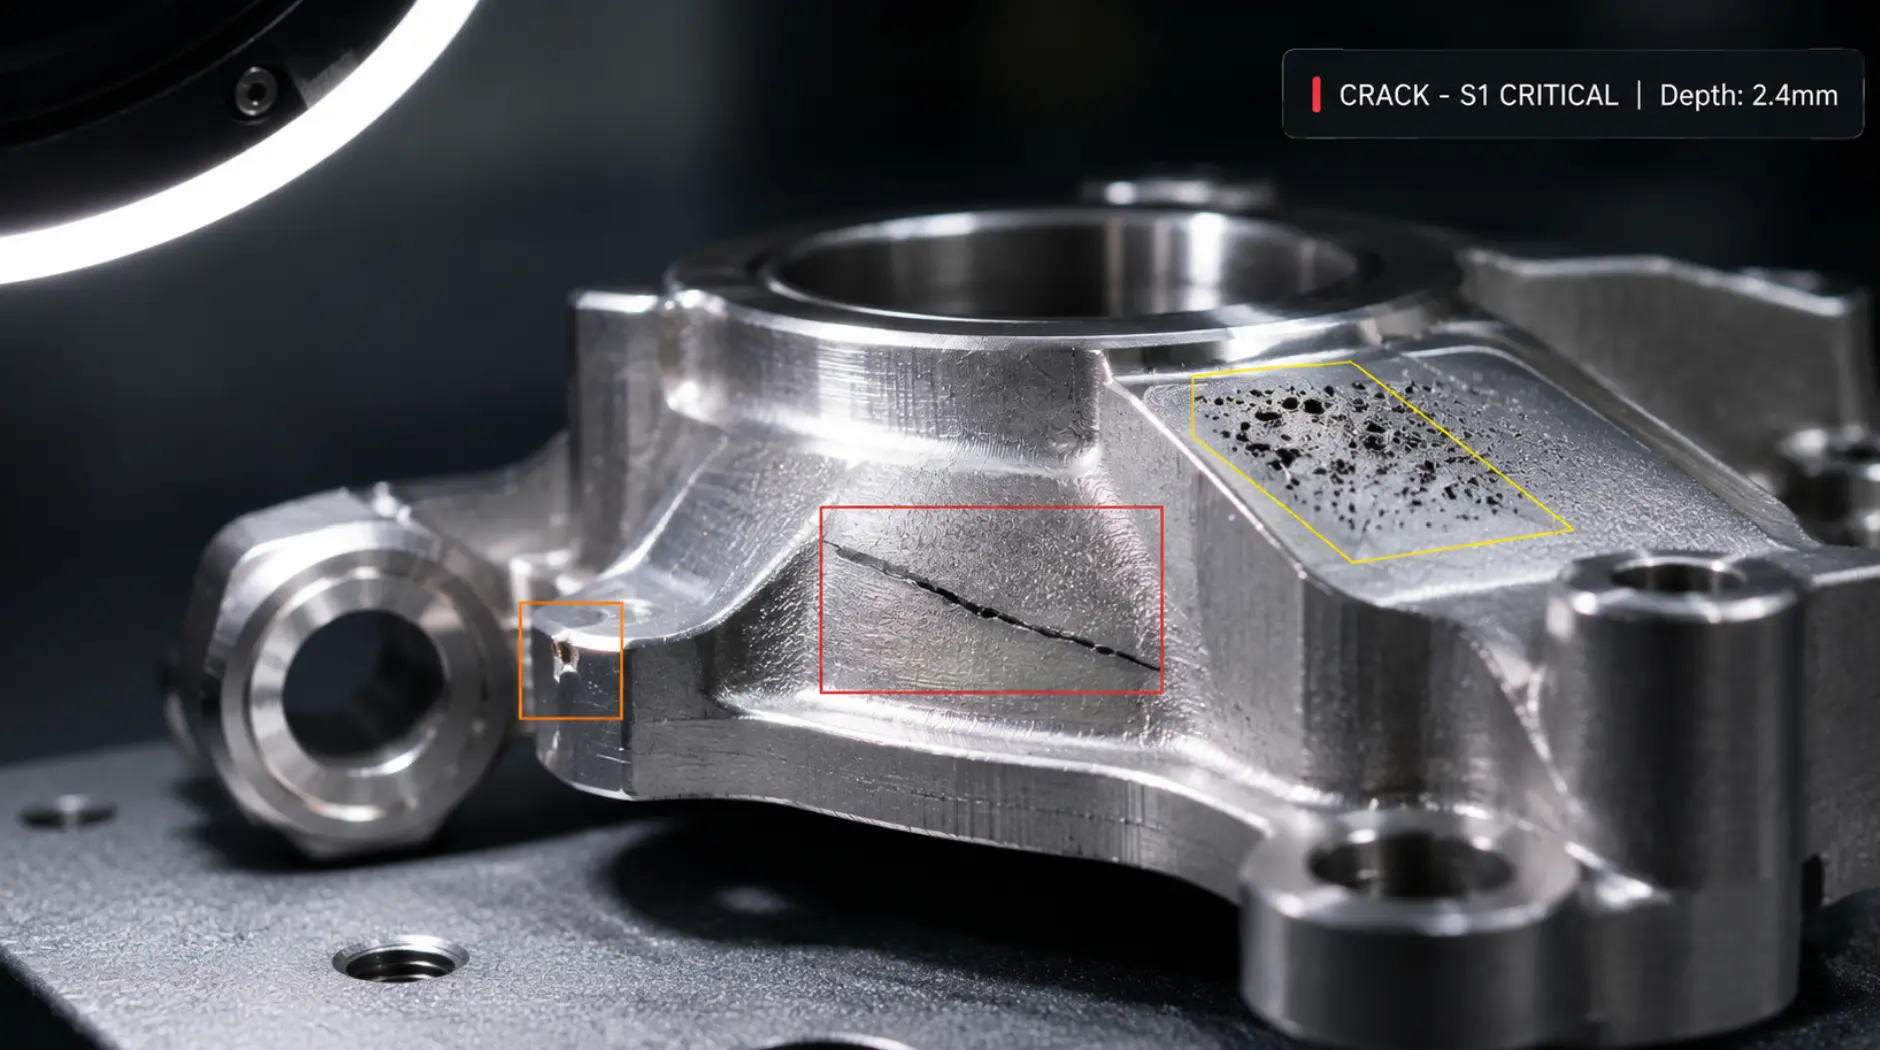
| Crack | Surface crack, sub-surface crack, fatigue crack | Linear or branching fracture in material substrate, visible on surface or detected via sub-surface imaging. | Polygon / Skeleton annotation | S1 | U-Net segmentation; anomaly detection for sub-surface |
| Burr | Machining burr, trim burr, cast burr | Unwanted raised material edge resulting from cutting, drilling or moulding operations. | Bounding Box + Edge mask | S2–S3 | High-resolution CNN with structured light |
| Surface Defect | Pit, porosity, inclusion, scale, delamination | Unplanned variation in surface texture, composition or continuity impacting function or aesthetics. | Semantic segmentation mask | S1–S3 | EfficientNet / ViT with multi-spectral imaging |
| Dimensional Anomaly | Over/under-dimension, out-of-round, flatness deviation | Measured geometry falling outside specified tolerance range for length, diameter, flatness or profile. | Measurement overlay / Keypoint | S1–S2 | Metrology AI + 3D vision (structured light / laser) |
Manufacturing Annotation Guidelines
- - CracksCracks must be annotated with skeleton (centreline) annotations, not bounding boxes, to accurately represent directionality and length for root cause analysis.
- - BurrsBurr annotations should capture both the burr location (bounding box) and the affected edge (polyline) to enable tooling wear correlation.
- - Dimensional AnomaliesRequire paired keypoint annotations: the nominal reference edge and the measured deviation point, with delta value in millimetres recorded in annotation metadata.
- - Surface DefectsSurface defects that cover >5% of a component face should be annotated with semantic segmentation masks rather than bounding boxes.
AI Model Note – Manufacturing Inspection
For dimensional anomaly detection, AI vision performs best when combined with inline metrology data from CMM systems.
Recommended workflow:
| Tier | Method | Purpose |
|---|---|---|
| Tier 1 | AI Vision Inspection | Fast screening of dimensional anomalies. |
| Tier 2 | CMM Verification | Precision validation of flagged parts. |
For surface defect detection on textured metallic components, Vision Transformer (ViT) models can deliver 6–12% higher sensitivity than CNN-based models in benchmark studies.
Recommendation: Use AI vision for rapid detection and CMM/metrology integration for high-confidence dimensional validation.
Industry 3: Oil & Gas Defect Taxonomy
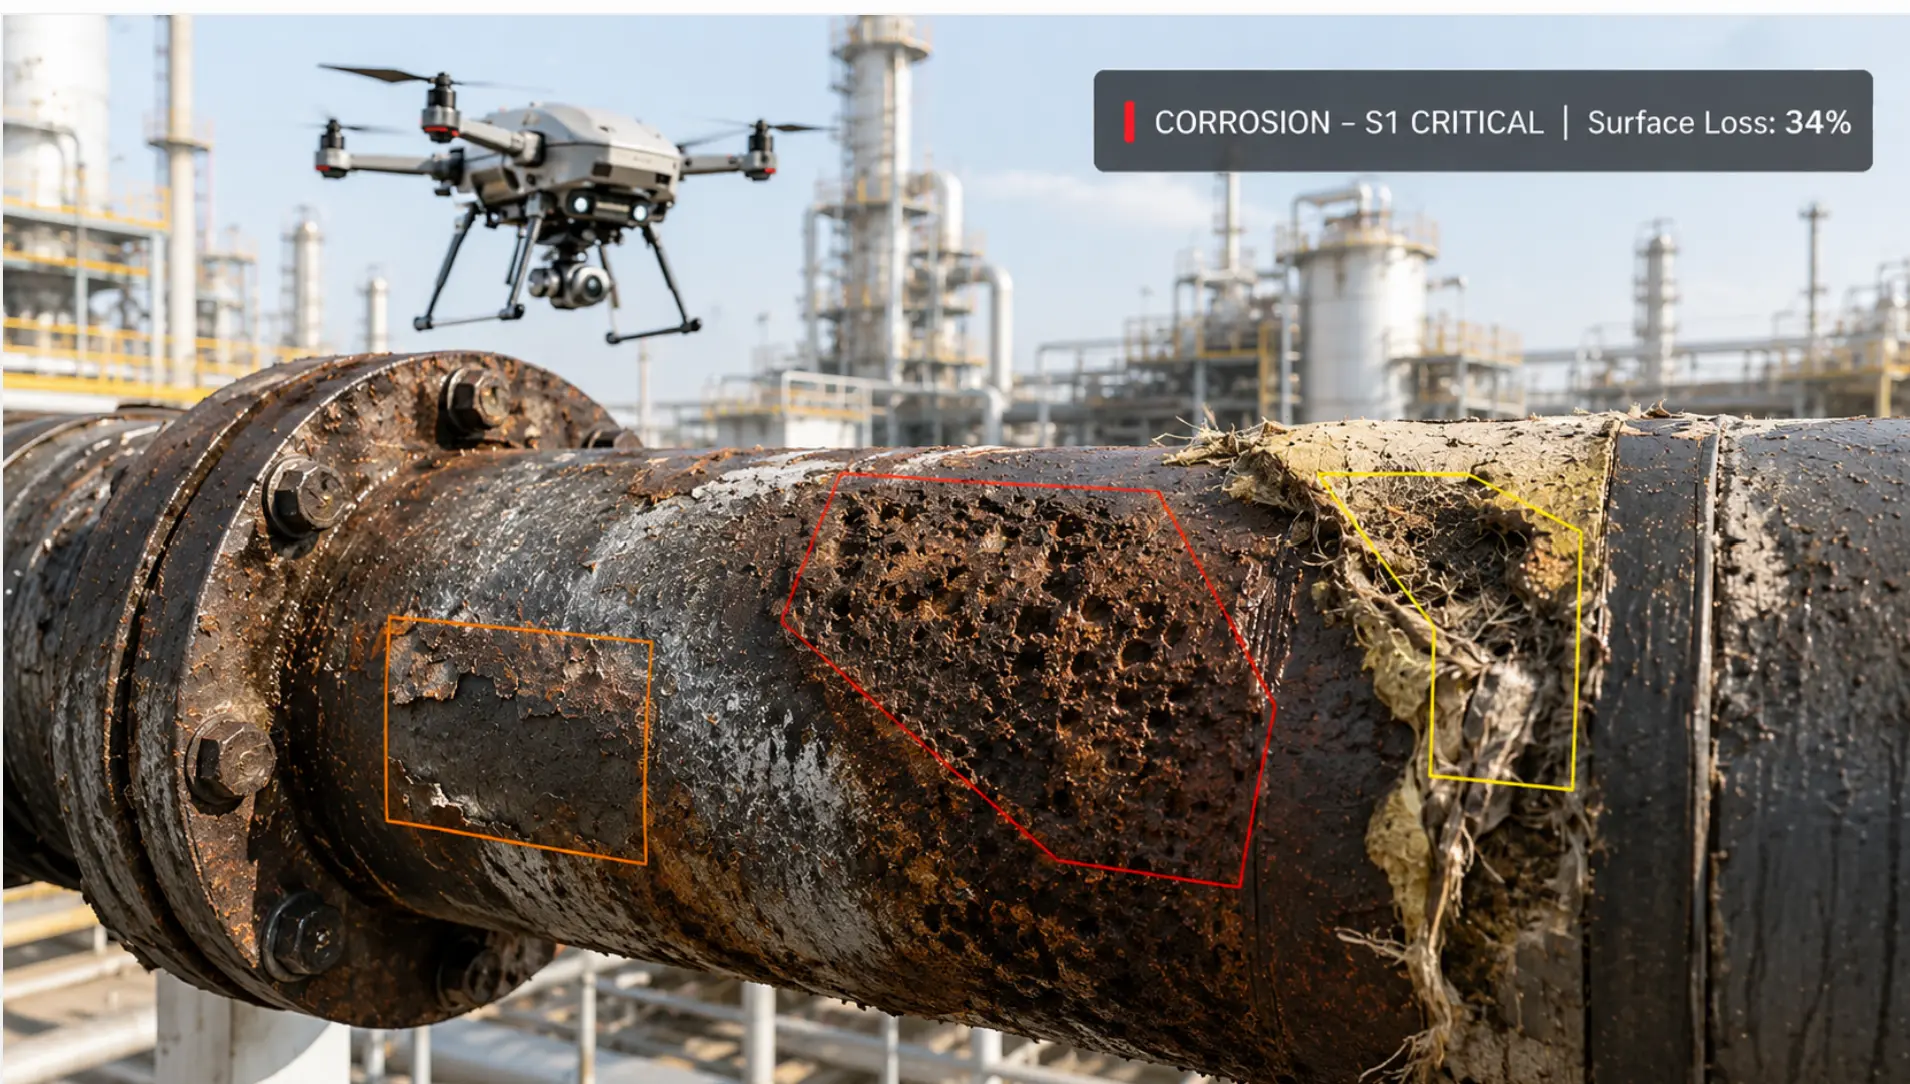
In oil and gas – spanning upstream exploration assets, midstream pipelines, and downstream refinery infrastructure – defects are not merely a quality issue. They are a safety, environmental, and regulatory imperative. The consequences of undetected corrosion or insulation failure on a high-pressure hydrocarbon pipeline can be catastrophic, making AI visual inspection a critical component of integrity management programmes.
| Defect Type | Sub-Type | Description | Annotation Type | Severity | AI Model Suitability |
|---|---|---|---|---|---|
| Corrosion | General corrosion, pitting corrosion, crevice corrosion, galvanic corrosion | Electrochemical degradation of metal surface due to environmental exposure, resulting in material loss. | Semantic segmentation + depth estimation | S1–S2 | U-Net / DeepLab + multi-spectral / thermal |
| Coating Loss | Disbondment, holiday, blister, chalking | Failure or absence of protective coating layer that exposes substrate to corrosive environments. | Polygon / Semantic mask | S1–S2 | EfficientDet + UV fluorescence imaging |
| Leakage Signs | Staining, crystalline deposit, wet patch, hydrocarbon sheen | Visual indicators of fluid escape from containment – including product staining, mineral deposits or hydrocarbon surface sheen. | Bounding Box + temporal change detection | S1 | Change-detection CNN + thermal IR camera |
| Insulation Damage | Weathered jacket, exposed insulation, CUI (corrosion under insulation) suspect | Degradation of thermal insulation system allowing moisture ingress or exposing pipe substrate to environment. | Polygon + classification label | S1–S2 | Thermal imaging AI + RGB fusion model |
Oil & Gas Annotation Guidelines
- - Corrosion PatchesCorrosion patches must be annotated with semantic segmentation masks that capture the full affected area, not point-and-click bounding boxes, due to the irregular spread of corrosion boundaries.
- - Leakage SignsLeakage sign annotations must include a temporal sequence reference – linking the current frame annotation to a baseline inspection image – to enable change detection models to calculate progression rate.
- - Coating Loss HolidaysCoating loss holidays (pinhole defects) should be annotated with circular polygon annotations no smaller than 16×16 pixels at the inspection camera resolution.
- - CUI Suspect ZonesCUI suspect zones should trigger a dual annotation: one label for the visible insulation jacket damage, and a second provisional label flagging potential substrate corrosion pending thermographic or UT verification.
AI Model Note – Oil & Gas Inspection
For leakage detection and corrosion classification, RGB camera data performs best when fused with thermal infrared imaging.
Recommended approach:
| Inspection Input | Purpose |
|---|---|
| RGB Imaging | Detects visible corrosion, coating damage, leakage marks, and surface anomalies. |
| Thermal Infrared | Identifies temperature variations linked to leaks, insulation defects, and early-stage CUI. |
RGB + TIR fusion models can reduce false negatives by up to 31% for early-stage CUI detection compared with RGB-only methods.
Recommendation: Use drone-mounted AI inspection systems that capture RGB + thermal data and send defect class, severity, and GPS location directly to the asset integrity system for automated work-order creation.
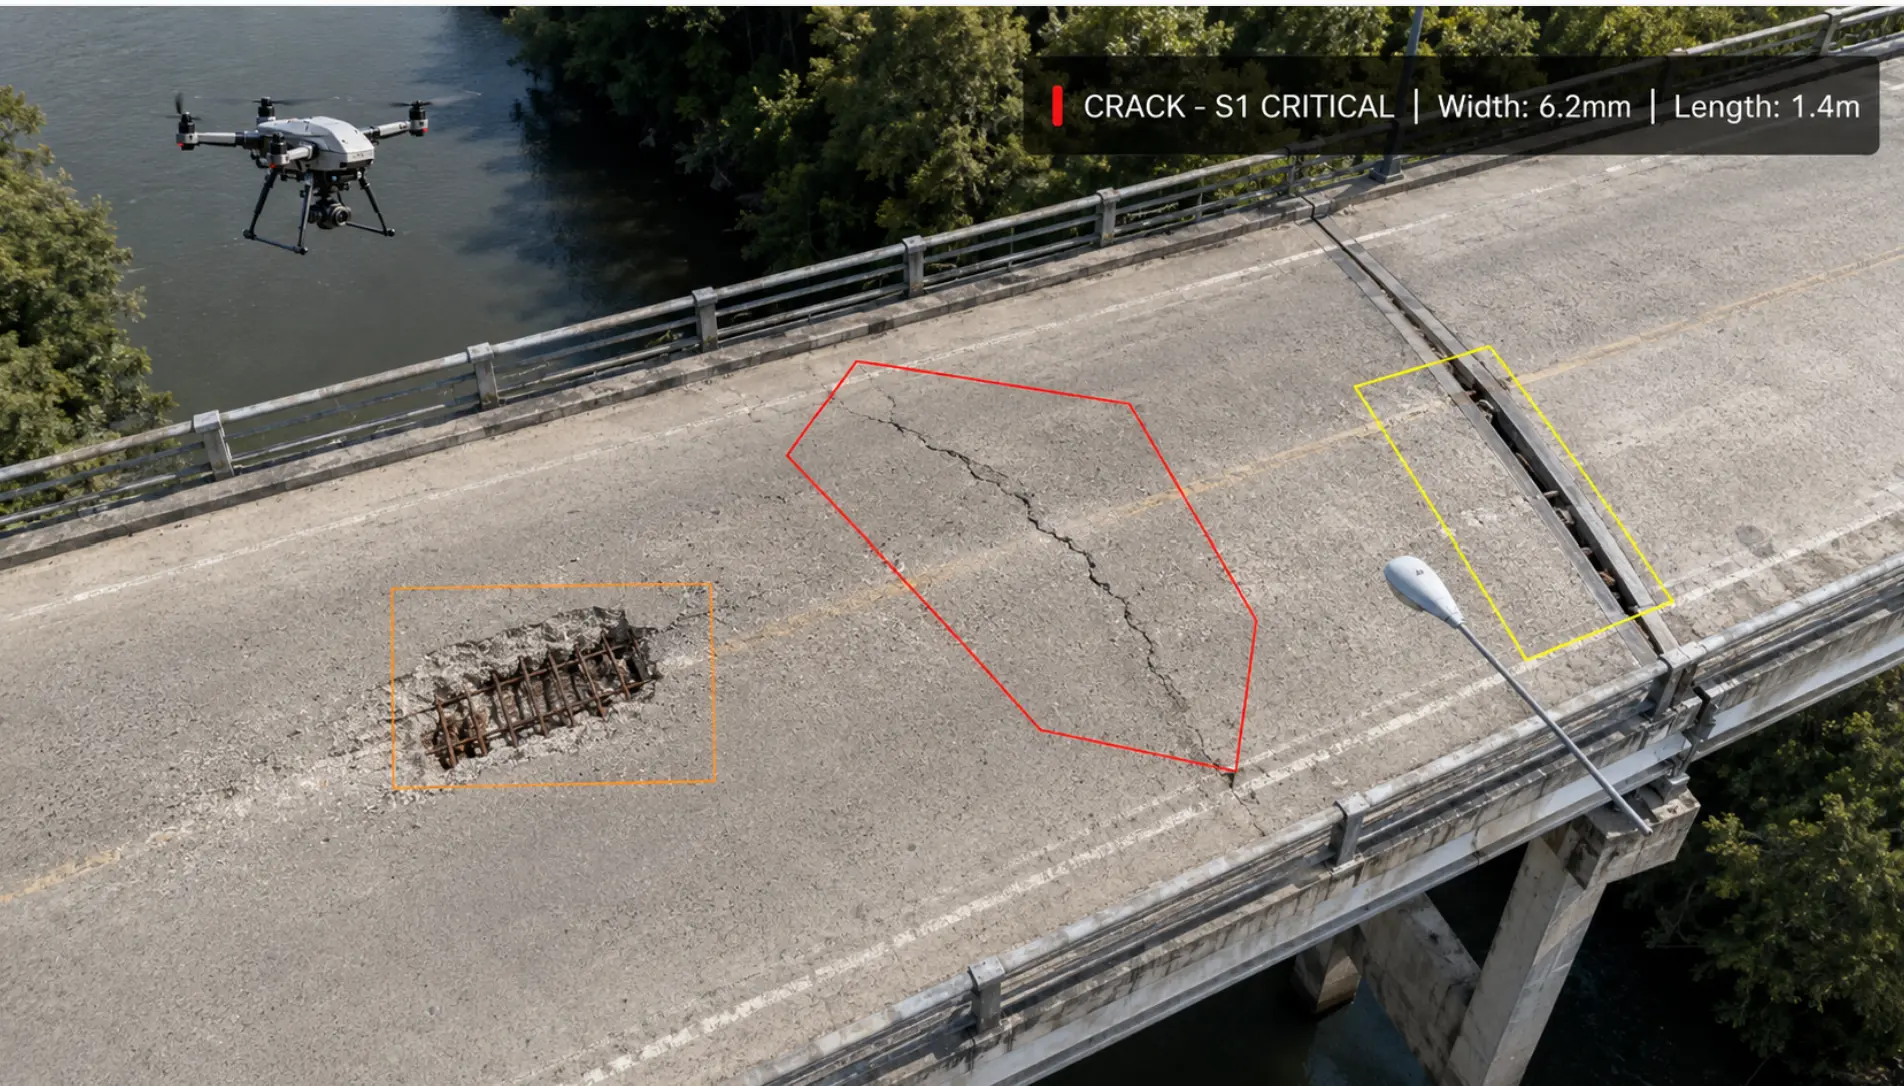
Industry 4: Infrastructure Defect Taxonomy
Infrastructure inspection – bridges, tunnels, roads, dams, retaining walls, and utility structures – represents one of the fastest-growing domains for AI visual inspection. Ageing assets, constrained maintenance budgets, and safety obligations are driving a rapid shift from periodic manual inspections to continuous AI-powered structural health monitoring.
| Defect Type | Sub-Type | Description | Annotation Type | Severity | AI Model Suitability |
|---|---|---|---|---|---|
| Crack | Hairline crack, structural crack, map (alligator) cracking, longitudinal/transverse | Fracture in concrete, masonry or asphalt substrate – classified by width, depth, orientation and pattern. | Skeleton + polygon annotation | S1–S3 | DeepCrack / U-Net segmentation; width measured via calibrated imagery |
| Spalling | Surface spalling, delamination, exposed rebar | Detachment of surface concrete layer, often exposing underlying reinforcement to environmental attack. | Polygon / Semantic mask | S1–S2 | EfficientDet + 3D point cloud for depth estimation |
| Rust / Staining | Rebar rust staining, efflorescence, biological staining | Surface discolouration indicating subsurface corrosion or moisture-driven mineral migration. | Bounding Box / Semantic mask | S2–S3 | HSV colour space classification + CNN |
| Deformation | Settlement, heave, buckling, tilt, differential displacement | Macro-level geometric change indicating structural movement beyond design limits. | Keypoint + 3D deformation map | S1 | 3D reconstruction + temporal change-detection AI |
| Joint Damage | Expansion joint failure, seal loss, misalignment, debris accumulation | Failure or degradation of designed movement accommodation joints critical to structural performance. | Bounding Box + classification | S1–S2 | YOLO object detection; classification head for joint condition rating |
Infrastructure Annotation Guidelines
- - CracksCracks must be annotated with skeleton annotations capturing the full crack path, with crack width measured at three points (start, midpoint, end) recorded in metadata.
- - SpallingSpalling areas require polygon annotations with minimum 12 anchor points, capturing the outer boundary of concrete loss. Exposed rebar should receive a separate nested annotation.
- - DeformationDeformation annotations are best handled with 3D point cloud overlays, but where 2D imagery is used, paired keypoint annotations (reference point + displaced point) with distance metadata are required.
- - GPS and GIS LinkageAll infrastructure annotations should carry GPS coordinates (lat/lon/elevation) to enable GIS integration and asset management system linkage.
AI Model Note – Infrastructure Inspection
For crack detection in bridges and concrete assets, models trained only on laboratory datasets often underperform in real-world conditions due to variations in texture, weathering, lighting, stains, and surface ageing.
Recommended training approach:
| Data Source | Purpose |
|---|---|
| Lab Crack Datasets | Useful for initial model training and controlled defect learning. |
| In-Situ Field Data | Essential for real-world accuracy across actual bridge decks and concrete surfaces. |
At least 40% of training data should come from field inspection images.
Recommendation: Use drone-based inspection with AI defect detection + photogrammetric 3D reconstruction to create digital defect overlays for integration with BIM and asset management platforms such as Bentley AssetWise and IBM Maximo.
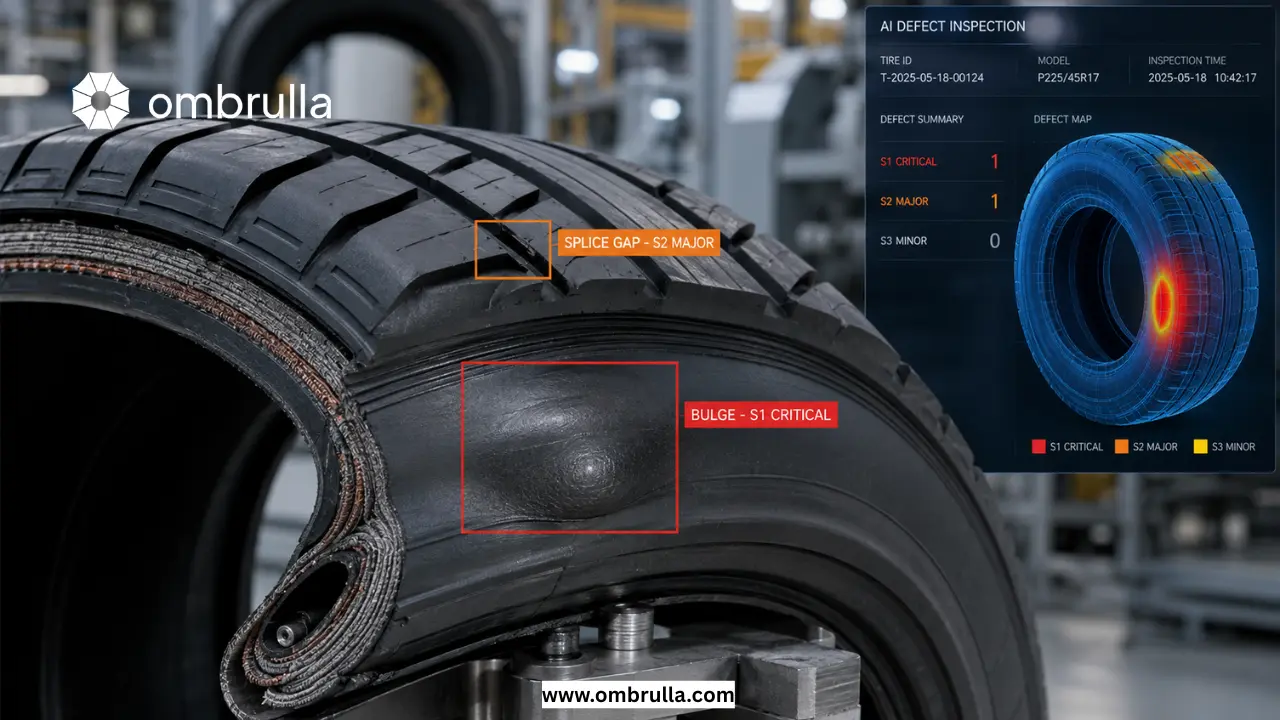
Industry 5: Tyre / Rubber Defect Taxonomy
Tyre and rubber product manufacturing is one of the most precision-intensive segments of the industrial economy. A tyre with an internal ply defect or an incorrect splice may perform correctly for thousands of kilometres before catastrophically failing at high speed. AI visual inspection in this sector must combine high-resolution surface imaging with sub-surface sensing modalities to provide complete quality assurance.
| Defect Type | Sub-Type | Description | Annotation Type | Severity | AI Model Suitability |
|---|---|---|---|---|---|
| Bulge | Sidewall bulge, tread bulge, inner liner bulge | Localised protrusion of tyre surface caused by internal structural weakness or air pocket. | Elliptical polygon + 3D profile | S1 | 3D laser profilometry + CNN classification |
| Splice Gap | Open splice, misaligned splice, under-lap, over-lap | Joining defect at the belt or ply termination point where material ends meet incorrectly. | Bounding Box + width measurement | S1–S2 | High-speed line-scan camera + CNN detector |
| Ply Defect | Ply separation, ply fold, missing cord, broken cord | Structural defect within the reinforcing ply layers affecting tensile integrity and pressure retention. | Semantic mask (X-ray / shearography frame) | S1 | X-ray AI + shearography interferometry analysis |
| Sidewall Issues | Cut, scuff, blister, marking error, open crack | Surface or structural anomalies on the tyre sidewall affecting appearance, labelling accuracy or structural integrity. | Polygon annotation | S1–S3 | High-resolution CNN + raking-light line scanner |
Tyre/Rubber Annotation Guidelines
- - BulgesBulge annotations should use elliptical polygon overlays with semi-major and semi-minor axis measurements recorded in metadata to enable volume estimation.
- - Splice GapsSplice gap width must be annotated with two parallel polylines at the gap edges, with gap width in millimetres captured as a metadata attribute.
- - Ply DefectsPly defects visible on X-ray or shearography imagery require semantic segmentation masks and must be labelled with the ply layer number as a sub-attribute.
- - Sidewall Marking ErrorsSidewall marking errors (incorrect DOT code, misprinted labelling) should be classified as a separate defect sub-type from structural sidewall defects and annotated with bounding boxes at character-level granularity.
AI Model Note – Tyre & Rubber Inspection
For tyre ply defect detection, X-ray imaging requires specialised CNN models trained on greyscale X-ray frames.
Recommended approach:
| Inspection Input | Model Strategy |
|---|---|
| X-ray Frames | Detect ply separation, voids, cord misalignment, inclusions, and internal structural defects. |
| Specialised CNN Models | Train on tyre-specific greyscale X-ray datasets, with transfer learning from proven X-ray architectures. |
Transfer learning from medical X-ray models can deliver strong results, with pilot datasets showing 89%+ sensitivity for ply defect detection.
Recommendation: Integrate real-time X-ray AI classification with the tyre building machine control system to enable immediate process correction and reduce scrap rates by up to 40%.