


What Is Predictive Maintenance?
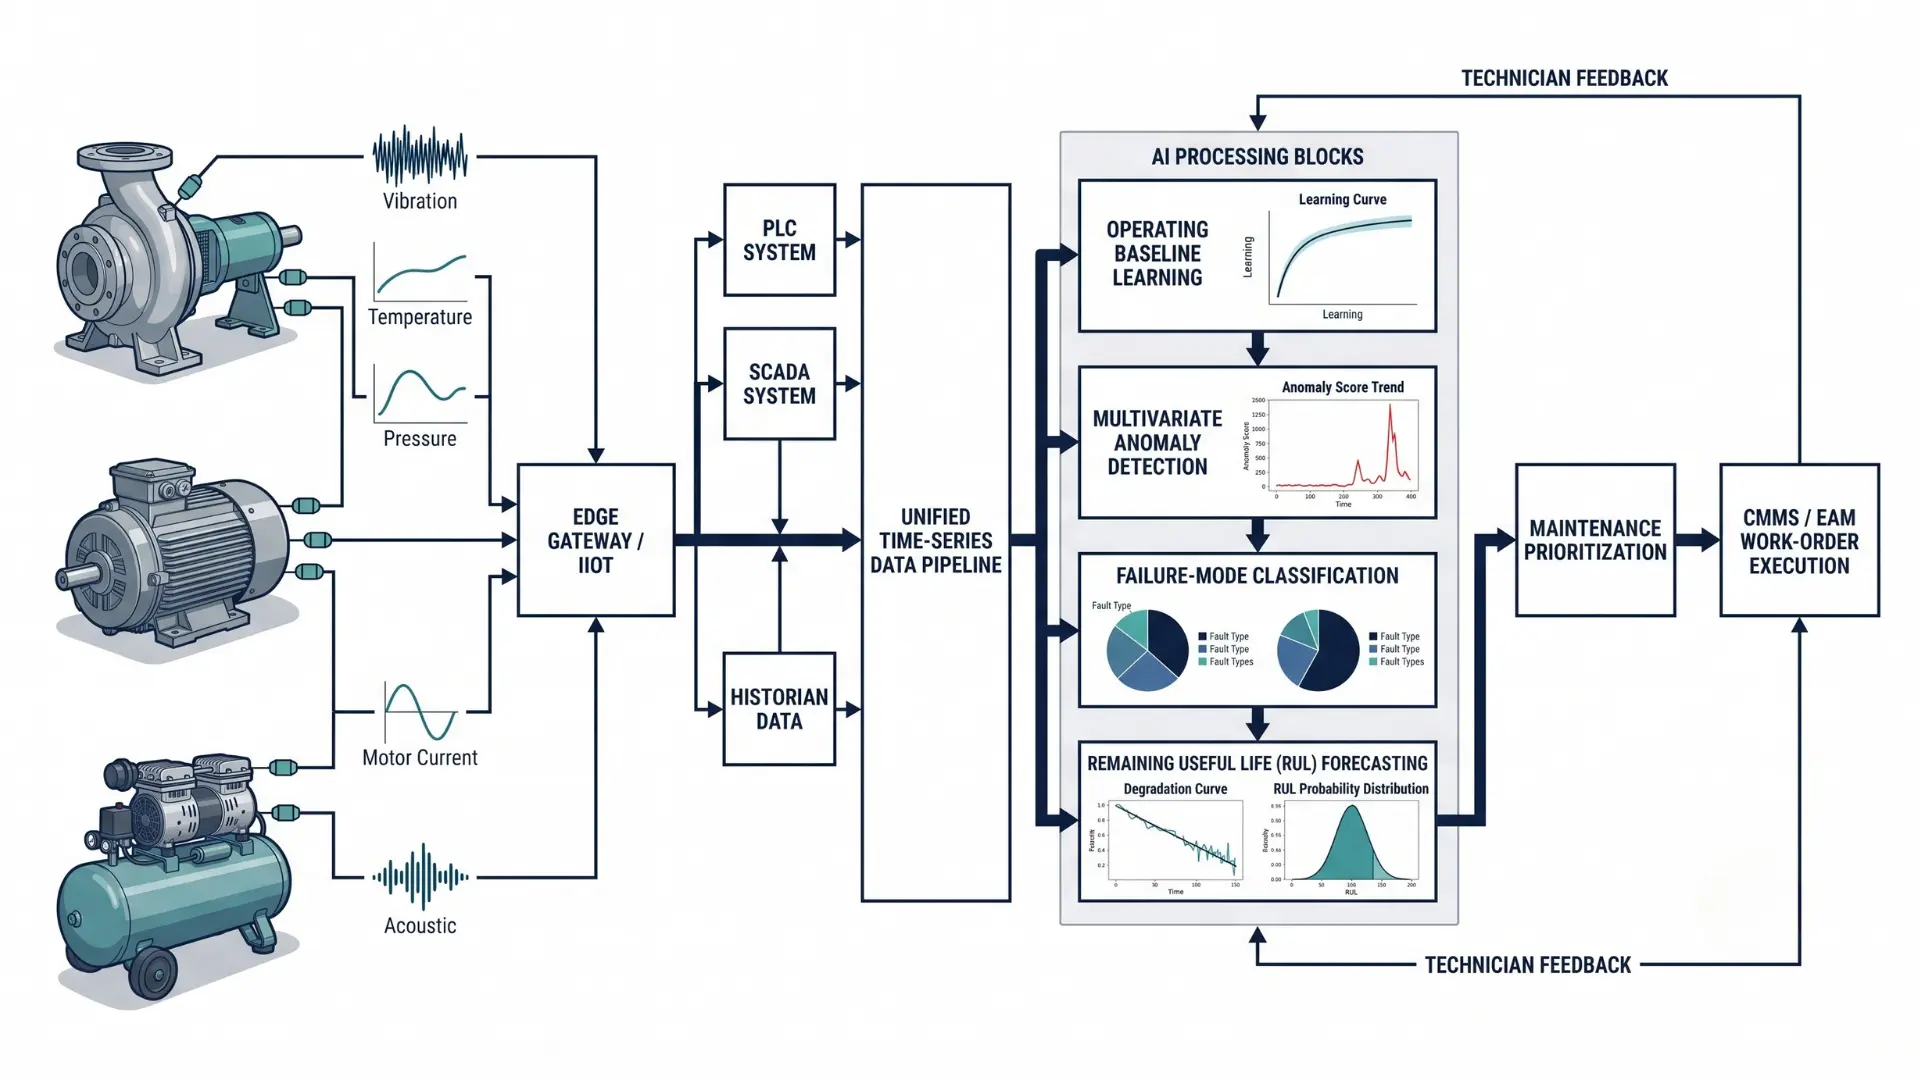
Predictive maintenance (PdM) is a proactive maintenance strategy that uses continuous condition monitoring - vibration, temperature, pressure, current, and acoustic data - analyzed by statistical or machine learning models, to forecast when a specific asset is likely to fail. The goal is to intervene at the optimal moment: late enough to capture the full useful life of the component, early enough to prevent unplanned downtime.
AI predictive maintenance software is the technology layer that operationalizes this at scale. Rather than a person manually reviewing trend charts, AI predictive maintenance software continuously ingests sensor and control-system data, learns what "normal" looks like for each specific asset across its full operating envelope, flags statistically meaningful deviations, classifies the probable failure mode, estimates Remaining Useful Life (RUL), and automatically raises a prioritized, evidence-backed work order in the CMMS or EAM system before the asset ever stops running. Platforms built for this purpose - Ombrulla's PETRAN asset performance management platform is one example - combine that analytics layer with the IoT connectivity, workflow automation, and governance controls that make predictive maintenance operational rather than an experimental dashboard nobody checks.
How AI Predictive Maintenance Software Works
Most production-grade platforms follow a consistent sequence:
1. Connect - Unify live and historical signals from IoT sensors, PLCs, SCADA, DCS, and historians into one data pipeline, without ripping out existing infrastructure.
2. Baseline - Use unsupervised machine learning to learn what normal behavior looks like for each asset, across every load, speed, and operating mode - not a single static threshold.
3. Detect - Continuously score multi-sensor signals for statistically significant deviations from that learned baseline, often weeks before a conventional threshold alarm would fire.
4. Classify - Map the anomaly's signature to a probable failure mode (bearing wear, misalignment, insulation breakdown, cavitation) using physics-informed models, so a technician isn't starting the diagnosis from zero.
5. Forecast Remaining Useful Life - Produce a probability window (a conservative, most-likely, and best-case estimate) rather than a single deterministic failure date.
6. Execute - Push a prioritized work order into the CMMS/EAM automatically, with sensor evidence and recommended action attached.
7. Learn - Capture technician feedback on whether the finding was accurate, and use it to continuously retrain and improve the model.
Core Technologies Behind Predictive Maintenance
A working knowledge of the underlying sensing and analytics stack helps reliability and finance leaders evaluate vendors on substance rather than marketing language:
- - Vibration analysis the primary diagnostic signal for rotating equipment (pumps, motors, compressors, CNC spindles); high-frequency envelope analysis detects bearing defects weeks ahead of failure.
- - Infrared thermography and temperature sensors flag overheating components, electrical connections, and insulation degradation.
- - Motor current signature analysis (MCSA) detects rotor and winding faults using existing electrical infrastructure, often without new hardware.
- - Oil analysis viscosity, particle count, and moisture content reveal internal wear and contamination, especially valuable for compressors and gearboxes.
- - Dissolved gas analysis (DGA) the standard diagnostic technique for power transformers, tracking gases like hydrogen, methane, and acetylene against known fault signatures.
- - IIoT connectivity protocols MQTT, OPC UA, Modbus/TCP, BACnet/IP, and DNP3 let a platform ingest data from mixed-vendor equipment without proprietary lock-in.
- - Edge computing runs inference locally for sub-second alerting and continued operation during connectivity outages, important for offshore, remote, or air-gapped sites.
- - Digital twins virtual models of physical assets used to simulate degradation and stress-test maintenance strategies before applying them in the field.
- - SCADA and PLC integration ties predictive models directly to existing control-system data (alarms, process variables, machine states) without disrupting production logic or requiring a rip-and-replace of automation infrastructure.
- - Cloud, edge, and hybrid architectures determine where AI inference actually runs, trading off latency, data sovereignty, and infrastructure cost; most mature 2026 deployments use a hybrid model, with edge pre-processing for real-time alerts and cloud models for fleet-level pattern recognition.
Where Preventive and Predictive Maintenance Fit in the Maintenance Strategy Spectrum
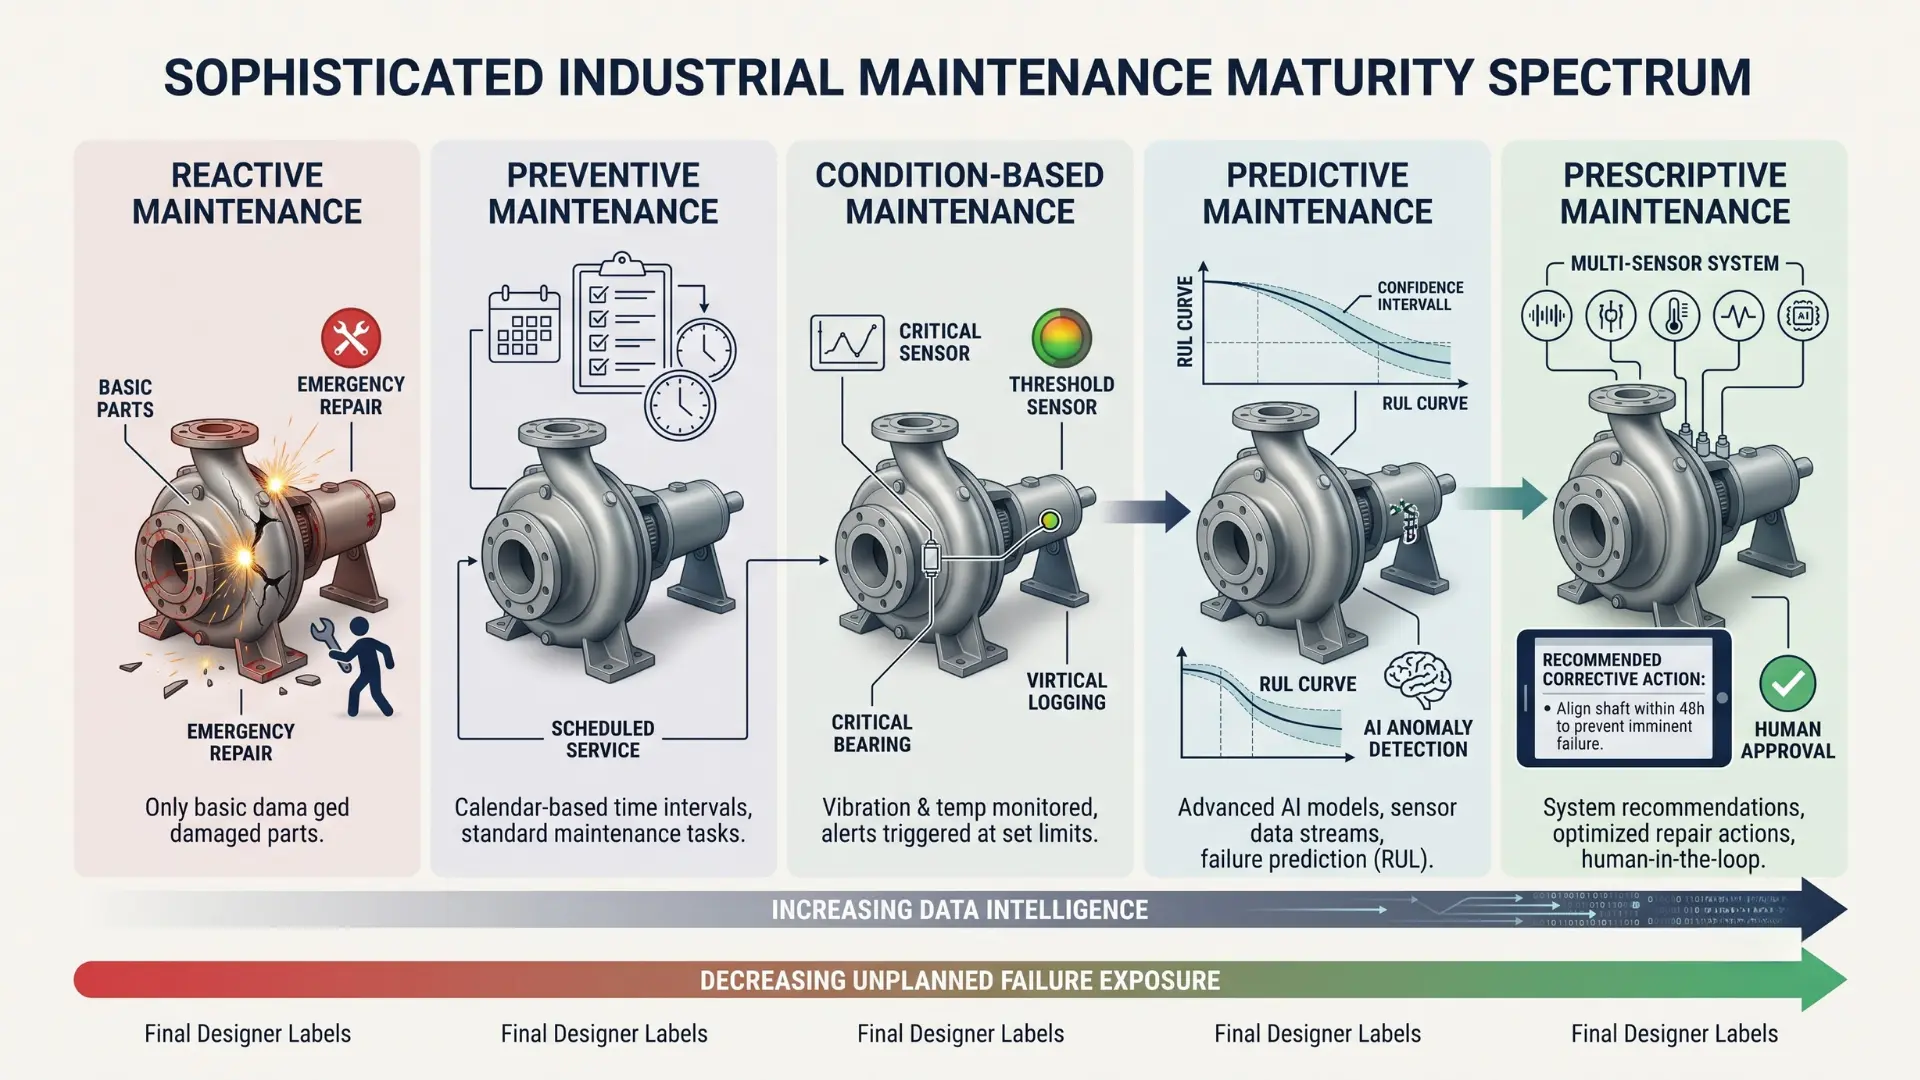
Preventive and predictive maintenance are two points on a broader spectrum, and precise terminology matters once you're building a business case that finance will scrutinize:
- - Reactive maintenance (run-to-failure)No intervention until the asset breaks. Appropriate only for low-cost, non-critical, easily replaceable equipment where failure carries no meaningful safety or production risk.
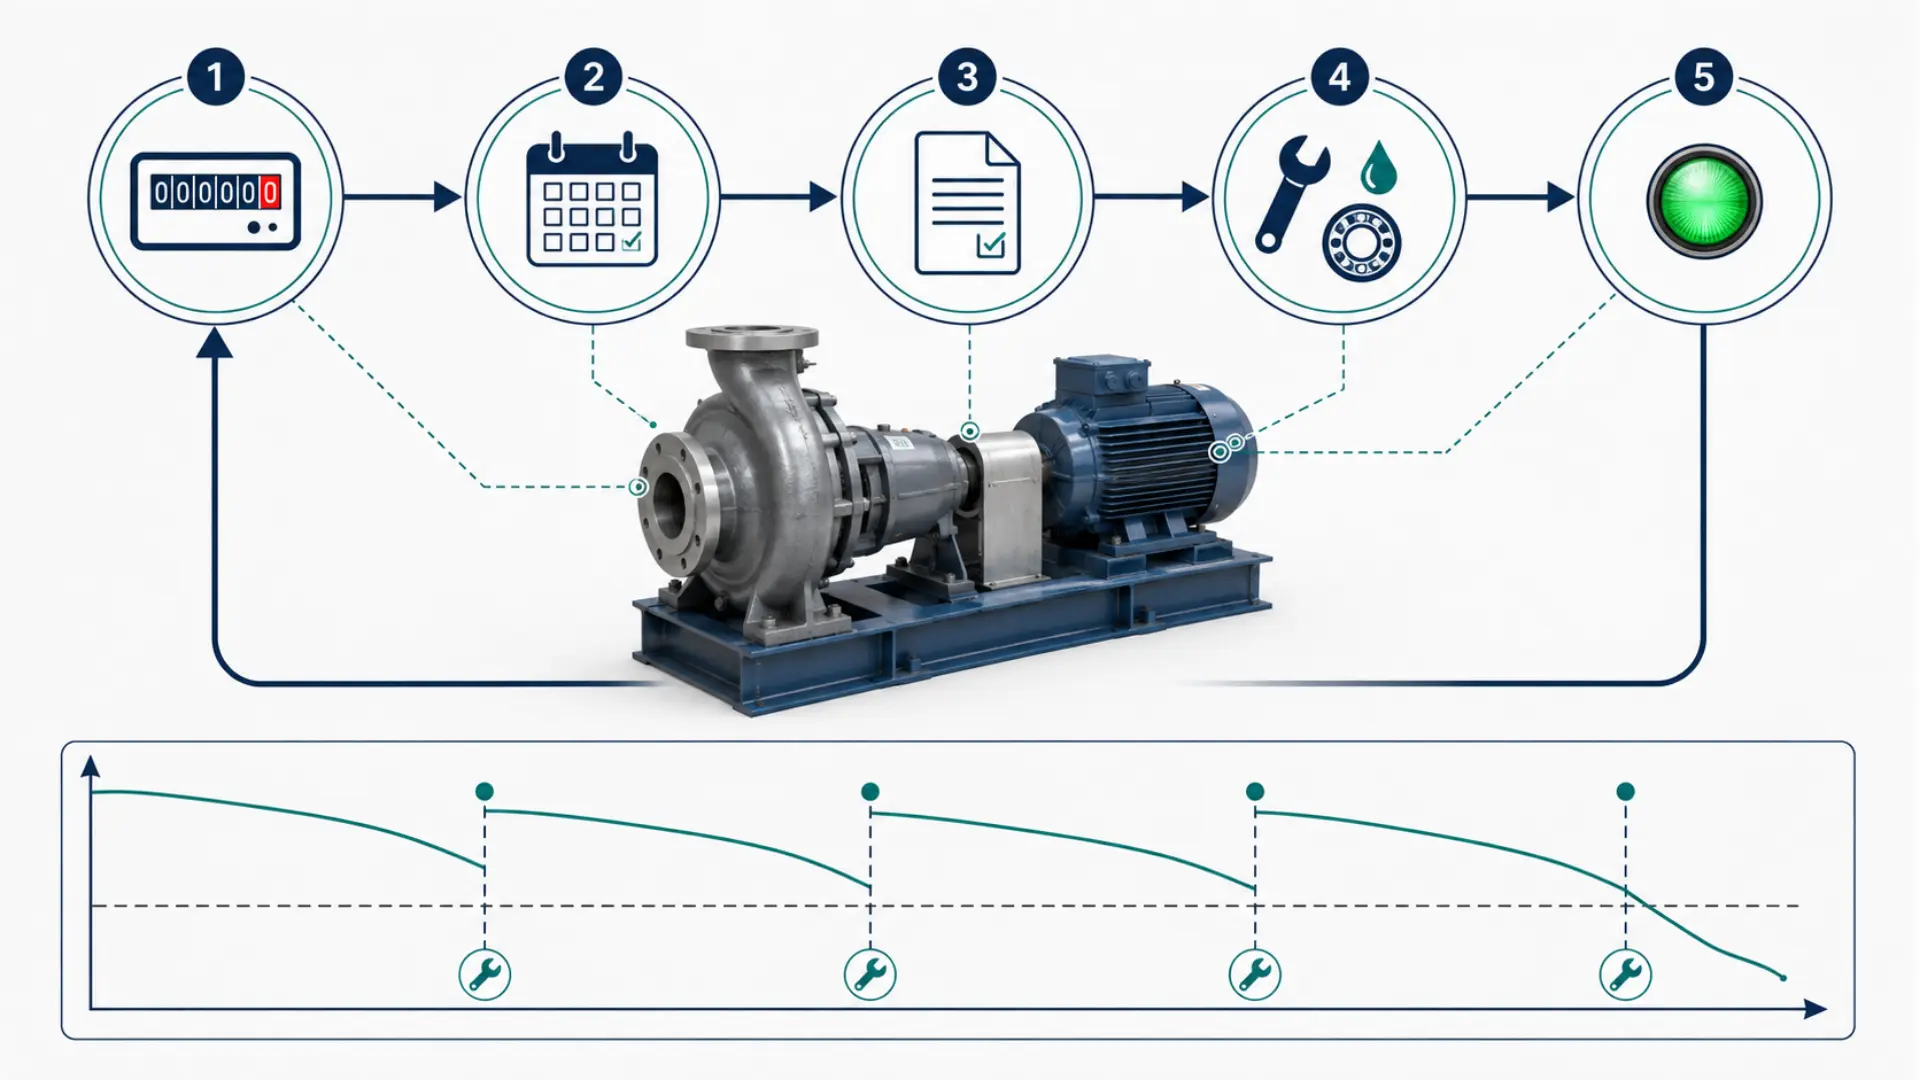
- - Preventive maintenanceScheduled, calendar- or usage-based servicing, described above.
- - Condition-based maintenance (CBM)A broader category that triggers action from a measured condition (a single sensor crossing a threshold, an oil sample flagging contamination) without necessarily forecasting when failure will occur. Predictive maintenance is best understood as an AI-driven, forward-looking form of condition-based maintenance.
- - Predictive maintenance (PdM)Condition monitoring plus machine learning to forecast failure timing and prioritize action, described above.
- - Prescriptive maintenanceThe emerging next step, where AI not only predicts the failure but recommends or automatically executes the corrective workflow (more in "The Future" section below).
Most mature reliability programs - and the ISO 55000 asset management standard that increasingly underpins them - treat this as a portfolio decision rather than a single company-wide policy. Different assets, at different criticality tiers, warrant different points on this spectrum, often within the same plant.
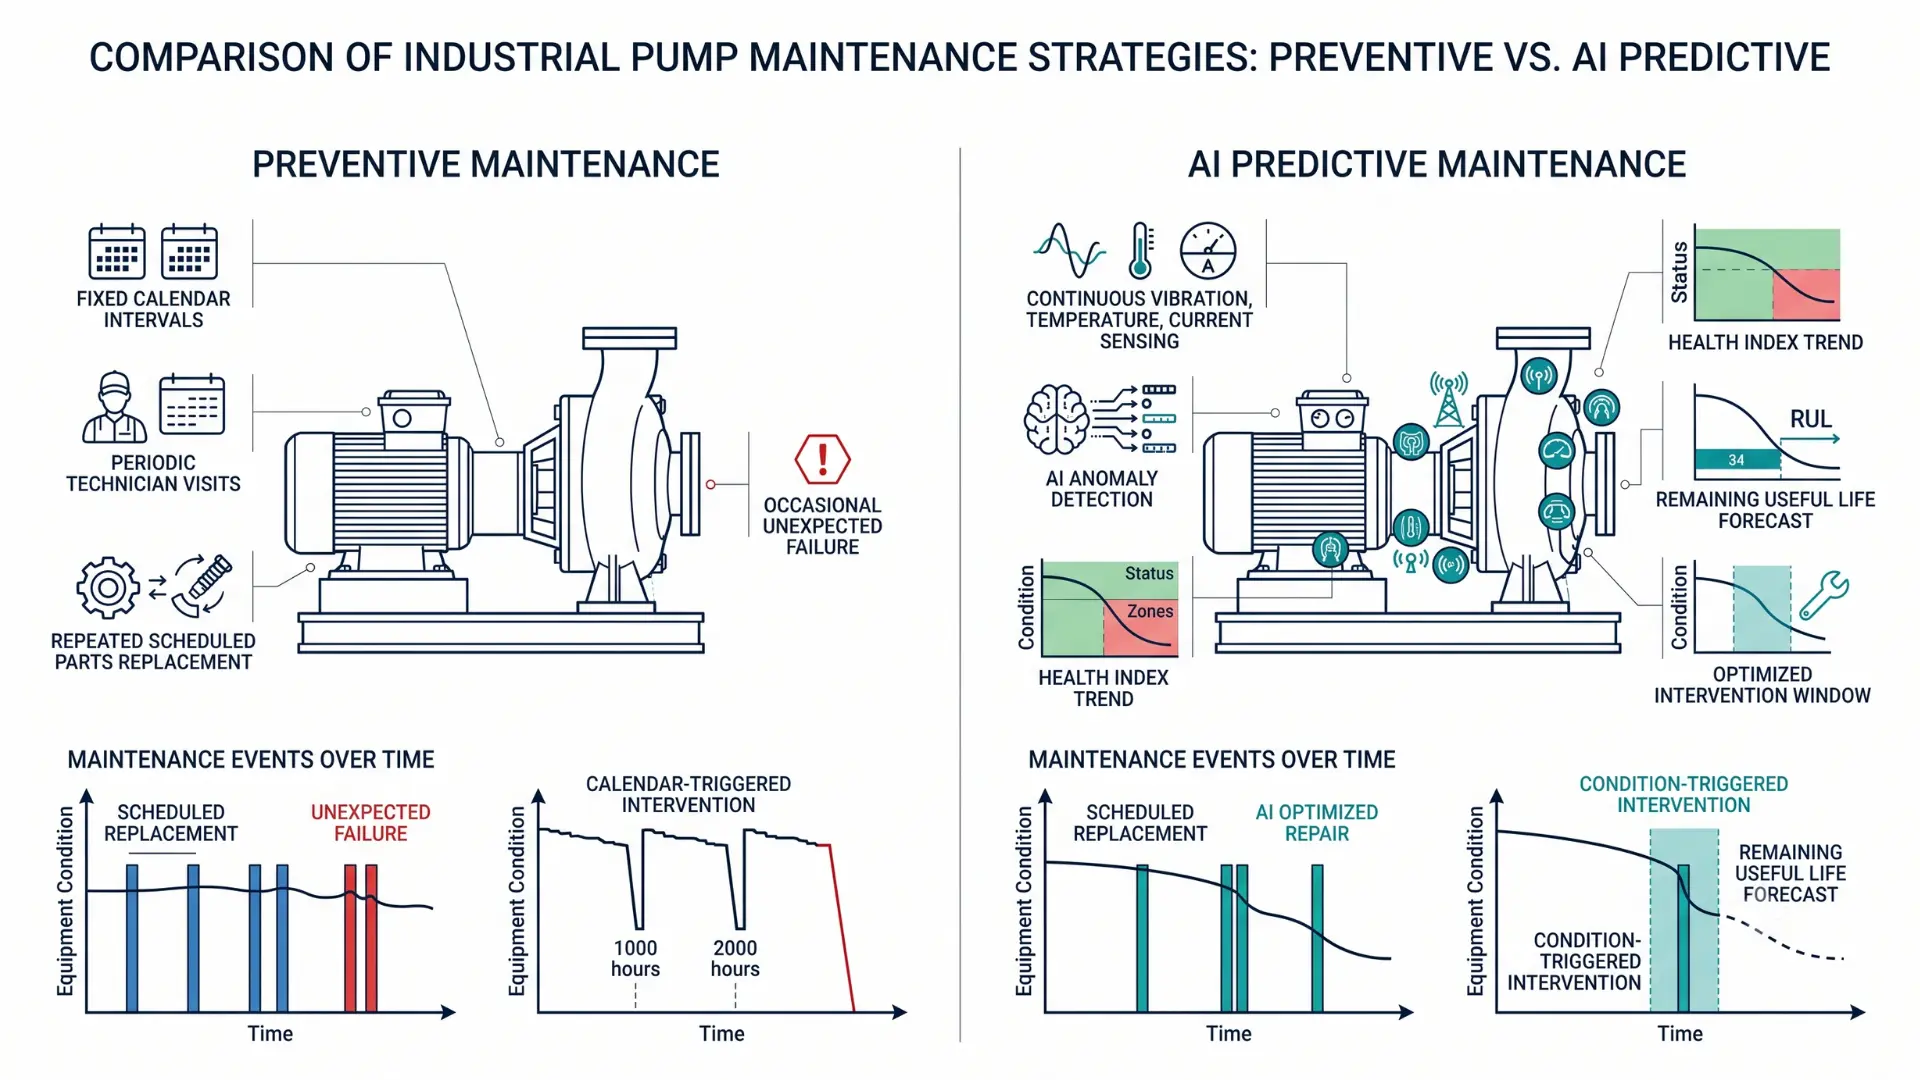
Preventive vs Predictive Maintenance: Key Differences at a Glance
| Dimension | Preventive Maintenance | AI-Powered Predictive Maintenance |
|---|---|---|
| Trigger for action | Fixed schedule (time, usage, or cycles) | Actual asset condition, detected from sensor data |
| Data requirement | Minimal - a calendar or run-hour meter | Continuous IoT sensor data plus historical context |
| Primary cost driver | Recurring labor and parts on a fixed cadence | Sensors, software, and integration, offset by avoided downtime |
| Failure coverage | Reduces failures vs. run-to-failure, but misses degradation between cycles | Detects developing faults days to months before failure |
| Over-maintenance risk | High - roughly 30% of PM tasks add no measurable value | Low - interventions are triggered by evidence, not the calendar |
| Best-fit assets | Low-criticality, inexpensive, linear-wear equipment; regulatory-mandated tasks | High-criticality, expensive, safety-critical, or erratically degrading assets |
| Typical downtime impact | Meaningful improvement over reactive-only operations | An additional 30-50% reduction in unplanned downtime vs. preventive-only programs (McKinsey) |
| Implementation complexity | Low - most CMMS platforms support it out of the box | Moderate to high - requires sensors, integration, and model tuning |
| ROI horizon | Immediate, but with a capped upside | Typically a 6-24 month payback, with returns that compound as models mature |
QUICK ANSWER
The core difference is what triggers the work. Preventive maintenance acts on a schedule; predictive maintenance acts on evidence. Neither is inherently "better" in isolation - the right strategy depends on the asset's criticality, cost, failure pattern, and how expensive an unplanned stoppage would be.
The Business Case for 2026: Why This Decision Matters Now
Why 2026 Is a Tipping Point
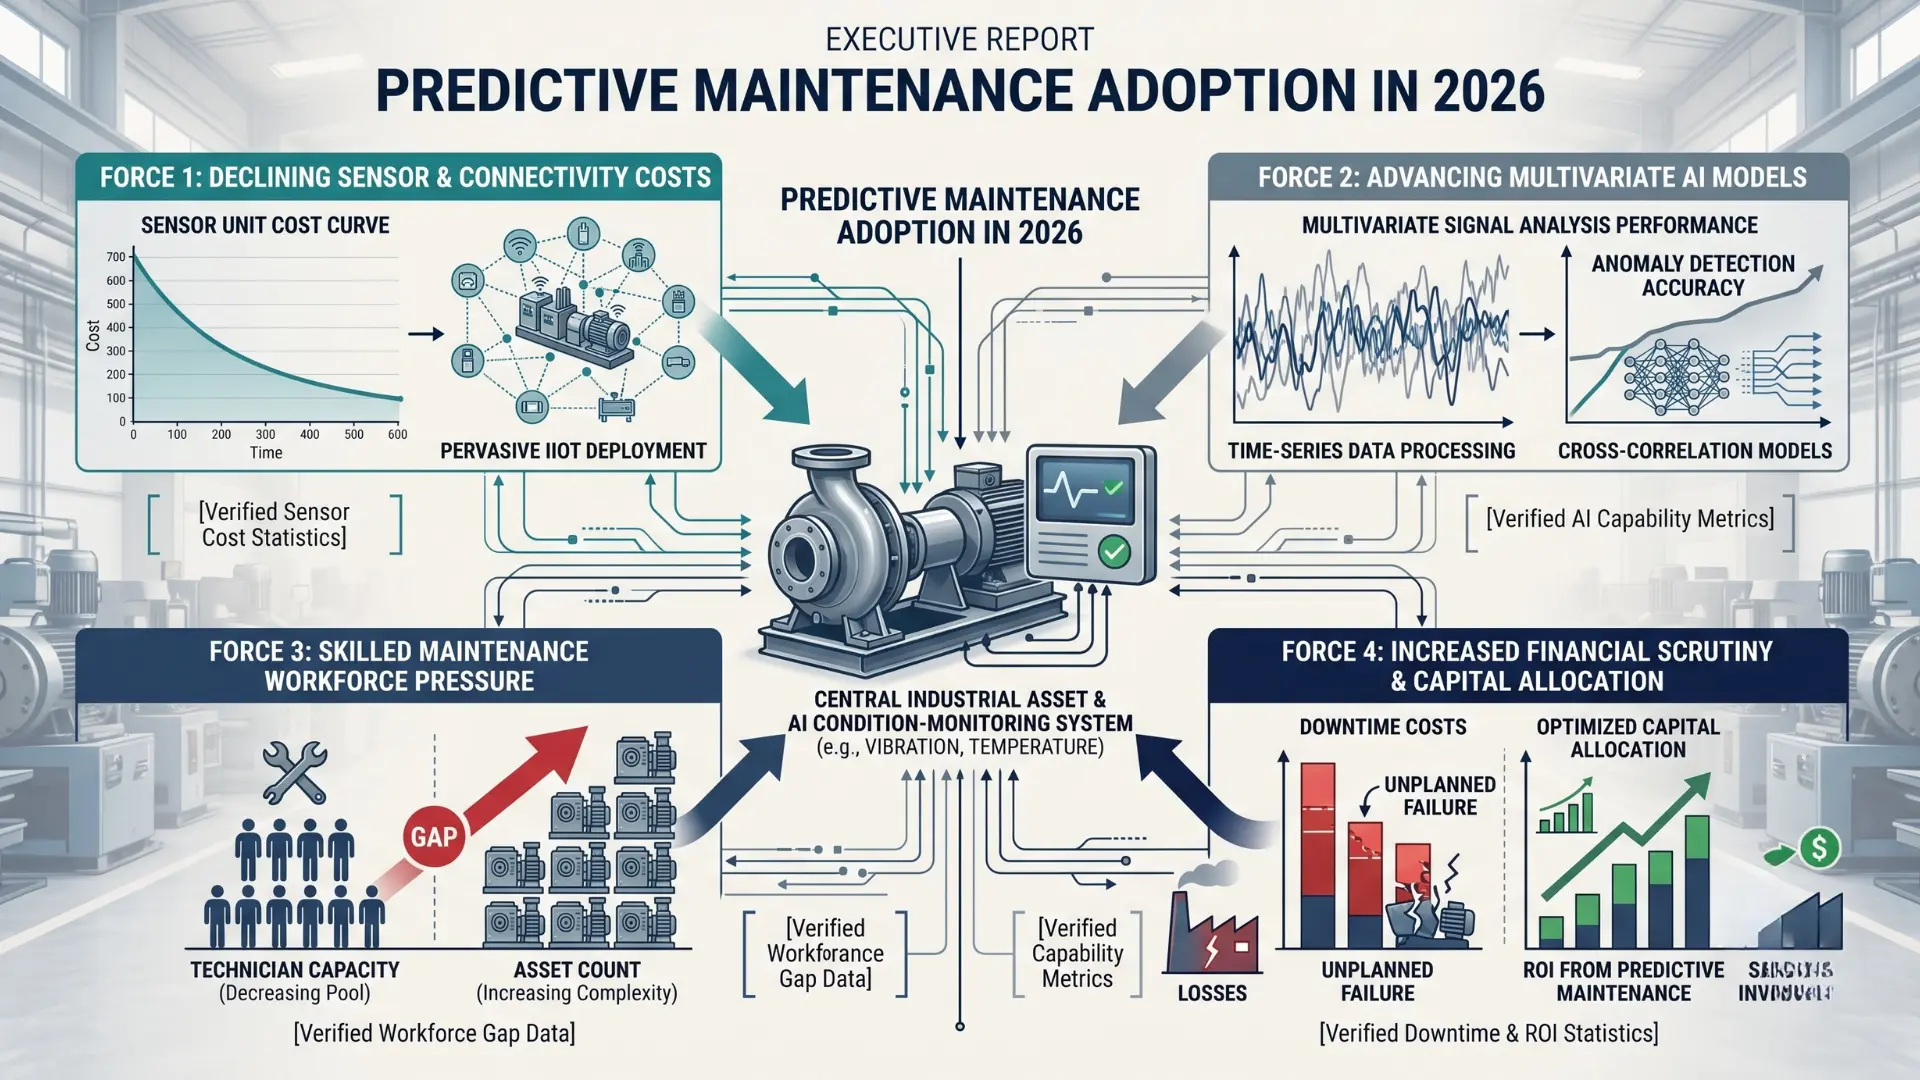
Several forces are converging to make this year a genuine inflection point rather than another incremental step in industrial software adoption:
- - The market has scaled past the pilot stageAnalyst estimates for the global predictive maintenance market in 2026 range from roughly $13 billion to $20 billion, with most firms - including Grand View Research, MarketsandMarkets, and Mordor Intelligence - projecting compound annual growth in the mid-20s to mid-30s percent through the early 2030s. That growth reflects real deployments, not just vendor hype.
- - Sensor and connectivity costs have fallen sharplyIndustrial IoT sensor prices have dropped by roughly 40% since 2020, based on data from the U.S. Department of Energy's Advanced Manufacturing Office, which changes the ROI math for instrumenting assets that weren't previously cost-justified.
- - AI models need less historical data to be usefulFoundation models trained across large industrial datasets can generate meaningful anomaly detection from day one for common equipment types (pumps, motors, compressors), rather than requiring 12-18 months of failure history before a program shows value.
- - The skilled maintenance workforce is shrinkingExperienced reliability technicians are retiring faster than they're being replaced, which raises the value of software that can triage anomalies, suggest a probable root cause, and route work automatically - effectively encoding institutional knowledge that used to live only in a veteran technician's head.
- - Maintenance strategy has become a board-level topicCapital allocation committees increasingly ask why a plant that runs a "textbook" preventive maintenance program still has unplanned outages - and predictive maintenance data increasingly supplies the answer.
The Real Cost of Getting Maintenance Strategy Wrong
The financial stakes are concrete, not abstract:
- - Unplanned downtime costUnplanned downtime is estimated to cost U.S. industrial manufacturers around $50 billion annually, according to research cited by the U.S. Department of Energy.
- - Operating expenditure shareMaintenance and related costs can represent 20% to 60% of total operating expenditure, depending on the industry and asset intensity, according to McKinsey research.
- - Wasteful preventive maintenanceAs noted above, roughly 30% of preventive maintenance tasks are performed on components that are still well within specification - a direct, measurable waste of labor and parts budget.
- - Accelerating hybrid adoptionA 2025 Plant Engineering survey found that 88% of manufacturers still run a preventive maintenance program, but 40% now also use predictive or analytics-based tools - evidence this is a rapidly consolidating middle ground, not a binary switch.
ROI Comparison: Preventive vs Predictive Maintenance for Finance Leaders
How the Cost Structures Differ
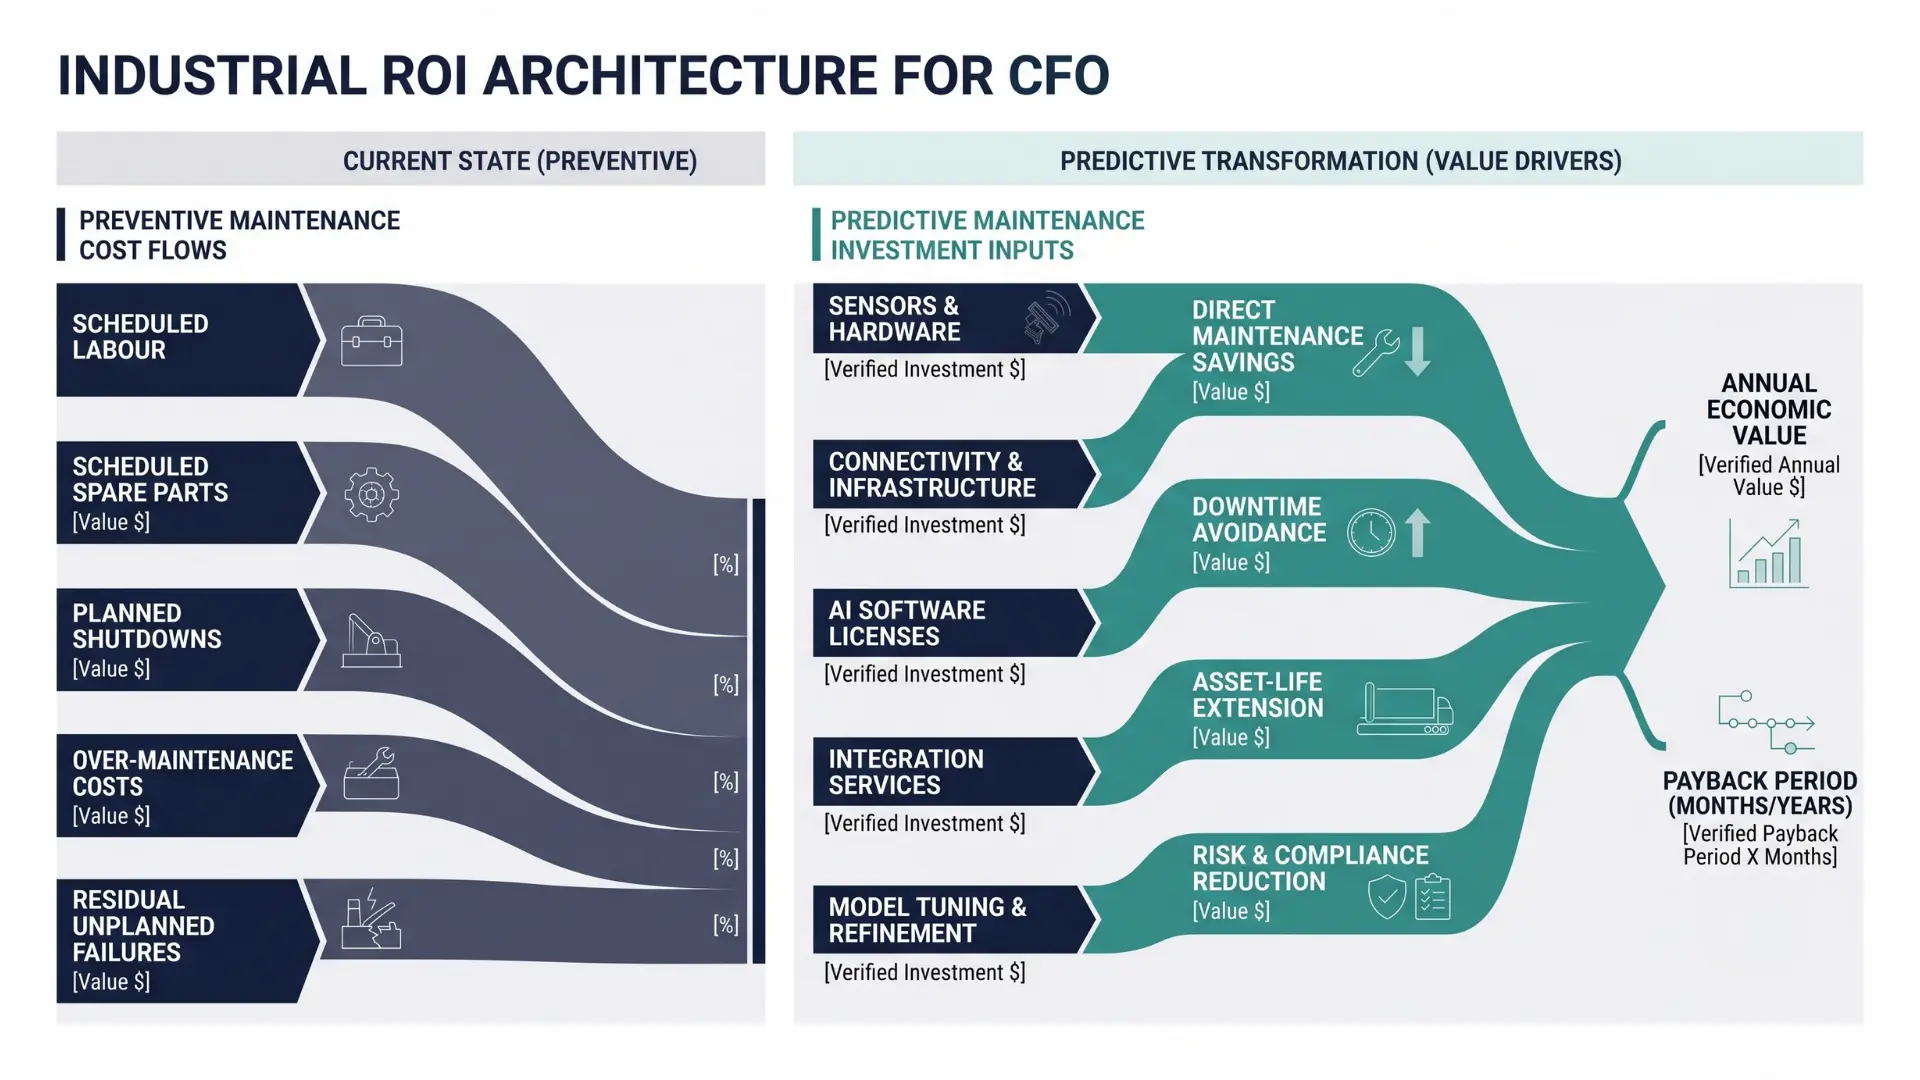
Preventive maintenance is largely an operating expense that scales linearly with the number of assets and the frequency of service - predictable to budget, but with a hidden cost in the form of the unnecessary work described above. It requires little upfront capital beyond a CMMS.
Predictive maintenance carries a different profile. There's an upfront investment in sensors, connectivity, software (often subscription-based), and integration with existing CMMS/EAM systems - plus a ramp-up period while models learn each asset's baseline behavior. What finance leaders are actually buying, though, is a claim on four distinct value streams, not just "fewer breakdowns":
| Value Category | What It Captures | Typical Share of Total Value |
|---|---|---|
| Direct maintenance savings | Reduced labor and parts from condition-based (not calendar-based) servicing | 25-35% |
| Downtime avoidance | Lost production, restart costs, and contractual penalties avoided | 35-45% |
| Asset life extension | Deferred capital replacement from optimized, less-invasive maintenance | 10-20% |
| Risk and compliance | Avoided HSE incidents, environmental fines, and insurance exposure | 10-15% |
Finance teams should model Total Cost of Ownership (TCO) rather than comparing sticker prices alone. A preventive-only program's TCO is dominated by recurring labor and parts, plus a large, often invisible line item: the unplanned failures that still occur despite the schedule. A predictive maintenance program's TCO includes software licensing (typically a per-asset or per-site subscription), sensor hardware amortized over three to five years, integration engineering, and ongoing model tuning - set against downtime avoidance, extended asset life, and reduced emergency-repair premiums, which typically run three to five times the cost of planned work.
A frequent reason predictive maintenance business cases fail to get approved - or under-deliver once approved - is that they model only the first line item and miss 60% or more of the total value available.
A Simple ROI Framework
A defensible, board-ready ROI model can be built from three formulas:
Annual Value = (downtime hours avoided × production value per hour) + (annual maintenance cost savings) + (probability of catastrophic failure × consequence cost) + (energy savings from optimized operation)
Net ROI (%) = (Annual Value - Annual Platform Cost) / Total Implementation Cost × 100
Payback Period (months) = Total Implementation Cost / (Monthly Value - Monthly Platform Cost)
Illustrative example: a mid-sized manufacturer with ten critical pumps, each averaging $12,000/hour in lost production value during an unplanned stop, currently loses roughly 60 unplanned-downtime hours a year across the fleet - about $720,000 in lost production, plus $180,000 in reactive maintenance premiums. A predictive maintenance deployment costing $90,000 to implement, benchmarked against the ranges below, might realistically avoid 60-70% of that downtime (roughly $430,000-$500,000 in recovered production value) and reduce the reactive maintenance premium by 25-30% (roughly $45,000-$54,000) - recovering close to $475,000-$560,000 annually against a $90,000 investment. That's a payback period measured in months, not years, which is precisely the kind of number a CFO can defend to the board.
Benchmark ROI by Asset Class
Real-world payback varies significantly by equipment type, largely driven by how expensive the asset is to replace and how far in advance its failure modes can be detected. Ombrulla's 2026 Industrial AI Predictive Maintenance Benchmark Report compiled the following ranges from OEM documentation, peer-reviewed studies, and verified deployments:
| Asset Class | Typical Maintenance Cost Reduction | Typical Payback Period | Illustrative 5-Year ROI |
|---|---|---|---|
| Centrifugal pumps | 28-38% | 3-10 months | 400-900% |
| Rotary compressors | 30-42% | 4-12 months | 350-800% |
| CNC machining centers | 22-38% | 6-18 months | 250-650% |
| Power transformers | 35-45% | 6-24 months | 500-2,000%+ |
These are benchmark ranges, not guarantees - actual results depend heavily on asset criticality, data quality, and how well the program is tuned in its first 6-18 months. Organizations in their first year of deployment should typically expect to realize 40-60% of mature-program benchmarks while models are trained and alert thresholds are calibrated. For a deeper, asset-by-asset breakdown - including failure modes, sensor requirements, and lead-time data - Ombrulla's benchmark report and predictive maintenance ROI calculator are useful next steps for building a site-specific business case.
Which One Should You Choose? A Decision Framework
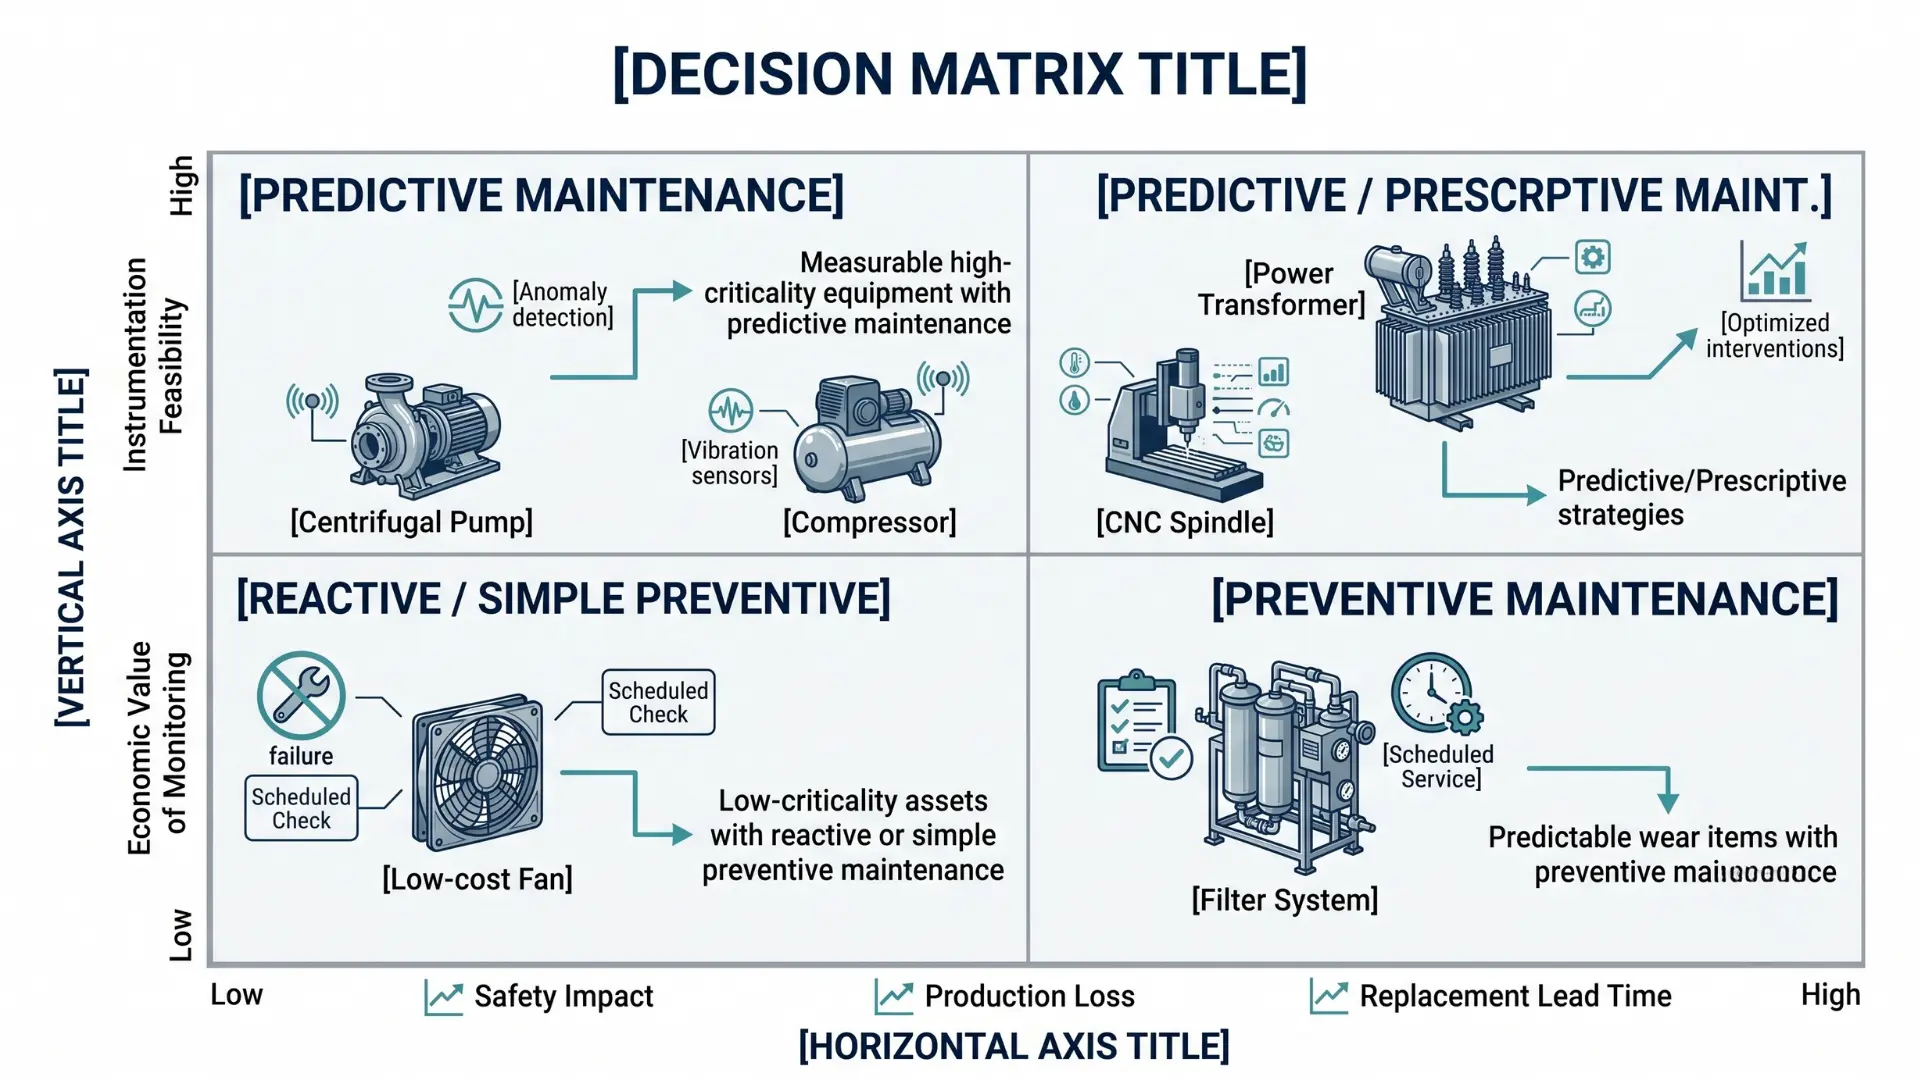
Reliability and finance leaders rarely need to choose one strategy exclusively - but they do need a defensible way to decide where each one applies.
When Preventive Maintenance Still Makes Sense
- - Low-criticality equipmentThe asset is low-cost and low-critical, and failure has minimal operational or safety impact.
- - Linear wear patternsThe component follows a well-documented, linear wear-out pattern (belts, filters, certain seals) where time-based replacement is genuinely the most efficient trigger.
- - Compliance mandatesA regulatory body or OEM warranty mandates a fixed inspection or service interval.
- - Foundational stageThe organization lacks the CMMS discipline or data foundation to support condition-based strategies yet - fixing basic planned-maintenance execution should come before adding sensors.
- - Instrumentation frictionThe asset is difficult or prohibitively expensive to instrument relative to its criticality.
When Predictive Maintenance Delivers the Best ROI
- - High consequence of failureThe asset is high-critical: its failure stops production, creates a safety hazard, or triggers a regulatory reporting event.
- - Long replacement lead timeReplacement lead time is long and expensive - a transmission-class transformer can take 40-60 weeks to replace and cost several million dollars, which makes even a few weeks of early warning extremely valuable.
- - Erratic degradationDegradation is erratic or load-dependent rather than linear, so a fixed calendar interval either over- or under-protects the asset.
- - Fleet consistencyThe organization operates a fleet of near-identical assets, where a model trained on one unit can generalize across the fleet and reduce the cost of the data-science layer.
- - Persistent PM failuresUnplanned failures are still occurring despite a well-run preventive maintenance program - a strong signal that the failure modes involved are condition-driven, not calendar-driven.
The Hybrid Reality: Why Most 2026 Programs Run Both
The evidence points to convergence, not replacement. As the Plant Engineering survey findings above show, the large majority of manufacturers still run preventive maintenance - the practical question in 2026 isn't "preventive or predictive," it's which assets in the portfolio deserve which treatment. This is the logic behind Reliability Centered Maintenance (RCM): rank assets by criticality and failure consequence, then assign reactive maintenance to the cheapest, lowest-risk equipment; preventive maintenance to predictable, regulatory, or low-value items; and predictive, condition-based maintenance to the critical few assets where downtime, safety, or replacement cost make early warning genuinely valuable. Comparing this against how AI-powered asset performance management platforms differ from a traditional CMMS or EAM system is a useful next step once the portfolio segmentation is in place.