
Multi-Spectral Vision AI for Sub-Surface and Thermal Defect Detection in Critical Energy Infrastructure
Abstract
Critical energy infrastructure - onshore and offshore pipelines, pressure vessels, heat exchangers, electrical substations, and power generation turbines - accumulates damage beneath its visible surface long before that damage manifests in a way that conventional optical inspection can detect. Insulation degradation allows moisture ingress that progresses silently to corrosion under insulation (CUI) for months or years. Micro-fractures nucleate at stress concentrations and propagate through pipe walls without producing any visible external signature. Subsurface fluid pathways develop within refractory linings and thermal coatings in ways that only become apparent to a visible-spectrum camera after the damage has already reached a critical threshold. By that point, a condition that was preventable has become a failure to manage.
This paper evaluates a multi-spectral inspection methodology that combines radiometric infrared (IR) detector arrays operating across short-wave, mid-wave, and long-wave infrared bands (SWIR, MWIR, LWIR), uncooled microbolometer thermal sensors for wide-area scanning, and high-resolution visible-spectrum industrial cameras, governed by a unified deep-learning classification pipeline. The core technical challenge addressed by the pipeline is the discrimination problem: industrial assets generate complex thermal signatures from normal operational processes - fluid flow, electrical resistive heating, surface emissivity variation, solar loading, and wind-driven convective cooling - that overlap spectrally with the thermal signatures of genuine structural defects. Conventional threshold-based thermal analysis produces unacceptable false-positive rates in these environments. The proposed pipeline addresses this through a multi-scale feature fusion architecture that extracts and correlates spatial, spectral, and temporal features from co-registered multi-modal image stacks, enabling the model to distinguish operational thermal patterns from pathological ones.
We evaluate the system on a dataset of 68,400 multi-spectral frame sets collected from active oil and gas pipeline corridors, refinery process units, and high-voltage electrical substations over an eighteen-month field study. The pipeline achieves 96.1% sensitivity and 94.7% specificity for combined defect detection across six defect classes: CUI, thermal insulation breakthrough, pipeline stress fracture, hazardous fluid leakage, electrical partial discharge signatures, and refractory lining delamination. We further present an enterprise governance model for cross-spectrum data array logging, audit trail management, and integration with predictive repair scheduling platforms.
Introduction
There is a recurring pattern in post-incident analyses of energy infrastructure failures: the defect was there, in hindsight, for months or years before the failure event. The stress fracture that produced the leak, the insulation damage that allowed moisture to initiate corrosion, the partial discharge activity that preceded the transformer fault - all of these left detectable signatures in the physical and electromagnetic characteristics of the asset. None of them was detected, because the inspection program in place was designed around what a technician could see with their eyes or measure with conventional contact instruments.
This is not a criticism of those inspection programs. Visible-spectrum optical inspection is fast, low-cost, and effective for a wide range of surface defect types. The problem is structural: the defect classes that cause the majority of catastrophic failures in critical energy infrastructure are not surface phenomena. They are subsurface phenomena that manifest thermally, spectrally, and structurally in ways that only become visible to an optical camera after they have already passed the threshold where intervention was cost-effective. By then, the choice is not between preventive maintenance and reactive maintenance; it is between emergency repair, production shutdown, or, in the worst cases, an environmental or safety incident.
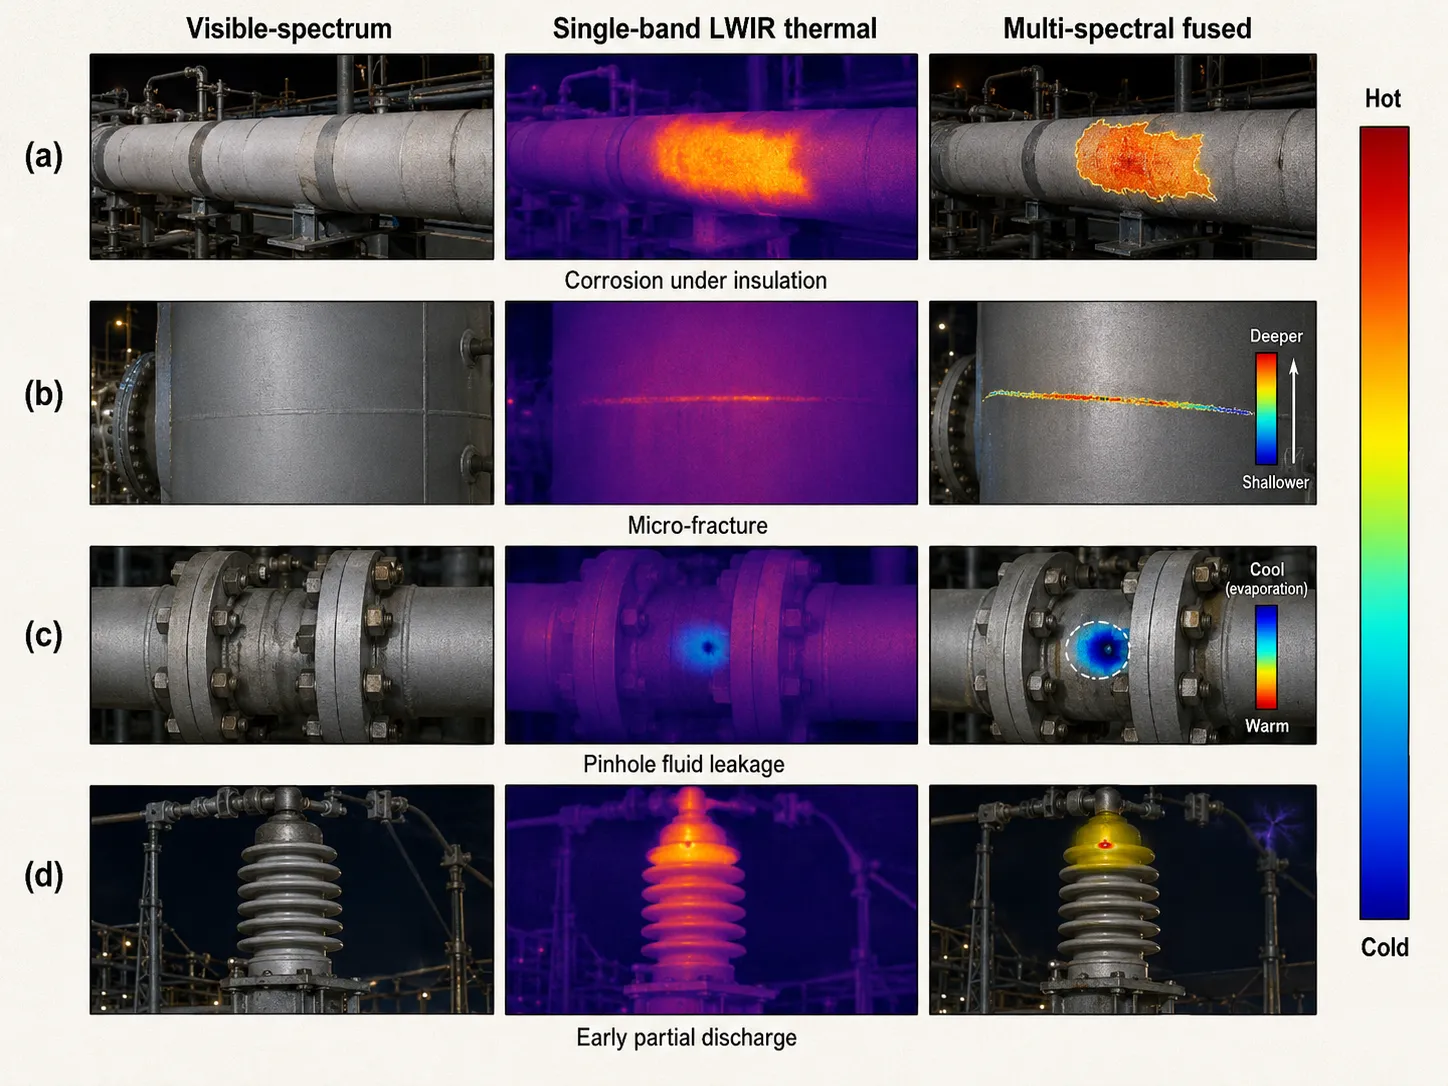
Multi-spectral thermal imaging addresses this gap by extending the inspection sensing envelope into the infrared. When heat conducts differently through a defective region than through surrounding intact material - which it always does, because defects alter the thermal conductivity, emissivity, and heat capacity of the material they affect - the difference is observable in a thermal image long before it produces any visible surface change. A corroded section beneath insulation, warmed by process heat, conducts that heat to the outer surface along a path altered by the moisture and corrosion products filling its void space. A stress fracture, even before it has propagated to the outer wall, creates a discontinuity in the thermal conduction path that produces a characteristic thermal signature in the surface temperature field. A fluid leak at a seal or flange creates a localized cooling pattern as the leaking fluid evaporates or a warming pattern as insulated hot fluid contacts the ambient surface.
The challenge that has limited practical adoption of thermal inspection in critical energy infrastructure is not the absence of thermal signatures; it is the difficulty of interpreting them reliably in the presence of operational thermal noise. An industrial asset is a complex thermal environment. Process fluid flows at different rates through different sections, creating legitimate spatial temperature gradients. Solar loading heats exposed surfaces differently depending on orientation and time of day. Electrical current through conductors heats them resistively according to load, which varies with production schedule. Convective cooling from wind and ambient air temperature variation creates transient surface temperature patterns. A thermal anomaly flagged by a simple threshold is as likely to reflect one of these operational variables as it is to reflect a genuine structural defect, and this ambiguity is exactly what has frustrated field adoption of standalone thermal inspection.
The multi-spectral deep-learning pipeline described in this paper addresses this challenge through two principal mechanisms. First, by combining radiometric IR data across three spectral bands (SWIR, MWIR, and LWIR) with co-registered visible-spectrum imagery, the pipeline provides the classification model with a richer evidence base than any single modality provides. Different defect types produce characteristic spectral signatures that are distinguishable from operational thermal patterns in multi-spectral space even when they are indistinguishable in any single band. Second, by processing multi-temporal image stacks rather than single frames, the pipeline enables the model to differentiate defect signatures, which evolve slowly and consistently, from operational thermal variations, which correlate with production cycles, weather, and time of day.
Related Work
Infrared Thermography for Industrial Inspection
Infrared thermography has a long history in industrial inspection, with passive thermography - imaging an asset in steady thermal state under ambient illumination - and active thermography - stimulating the asset thermally and imaging the transient response - representing the two principal approaches. Maldague's foundational work on nondestructive evaluation using infrared thermography remains a primary reference. Meola et al. review applications of infrared thermography to aerospace and composite structure inspection. Industrial applications to pipeline CUI detection are reviewed by Sfarra et al., who identify the primary limitation of field thermography as the high false-positive rate caused by surface emissivity variation, solar loading, and operational thermal gradients - the core challenge addressed in this paper.
Multi-Spectral and Hyperspectral Imaging for NDT
Multi-spectral and hyperspectral imaging have found increasing application in non-destructive testing (NDT) as detector array costs have fallen. Lu and Fei review hyperspectral imaging establishing the framework of spectral-spatial feature extraction. Khoury et al. apply multi-spectral imaging to concrete structure inspection, demonstrating improved crack detection sensitivity. For energy infrastructure specifically, combining SWIR, MWIR, and LWIR bands in a unified inspection platform has been demonstrated for natural gas pipeline leak detection by Thorpe et al., reporting that SWIR sensitivity to methane absorption provides unambiguous leak signatures invisible in longer-wave bands.
Deep Learning for Thermal and Multi-Modal Industrial Inspection
Deep learning applied to thermal images for industrial defect detection has been explored primarily in controlled laboratory settings. Denil et al. demonstrate that CNN-based classifiers trained on thermal images of composite panels achieve high performance on delamination detection. For field deployment under uncontrolled thermal environments, Ibarra-Castanedo et al. show that temporal processing of thermal image sequences substantially improves defect detection reliability relative to single-frame analysis. Multi-modal fusion of visible and infrared imagery using deep learning is demonstrated by Zhang et al., consistently outperforming single-modality baselines.
Governance and Data Management for Industrial Inspection AI
Governance requirements for AI-assisted inspection systems in safety-critical industrial environments are addressed in emerging standards including ISO 55001 (asset management), ASME PCC-2 (repair of pressure equipment and piping), and API 510/570/653 (pressure vessel, piping, and tank inspection). These standards define inspection data retention, audit trail, and finding classification requirements that any AI-assisted system must satisfy.
Defect Taxonomy and the Thermal Discrimination Problem
Six Primary Defect Classes
Six defect classes are targeted by the multi-spectral inspection system, selected on the basis of their failure consequence severity, their known thermal signature characteristics, and their frequency in energy infrastructure inspection programs:
- Corrosion Under Insulation (CUI)
Moisture infiltrating the insulation system accelerates corrosion of the underlying pipe or vessel wall at a rate inaccessible to surface visual inspection without insulation removal. CUI produces a characteristic warm anomaly in LWIR imaging due to altered thermal conductivity of moisture-saturated insulation.
- Thermal Insulation Breakthrough
Localized insulation failure or mechanical damage produces a hot spot through which process heat escapes to the outer surface. The LWIR signature is compact and intense, typically exceeding surrounding surface temperature by >15°C.
- Pipeline Stress Fracture
Fatigue or stress-corrosion cracks alter the thermal conduction path through the pipe wall, creating a linear thermal discontinuity. MWIR is most sensitive to the temperature gradient associated with the disruption.
- Hazardous Fluid Leakage
Hydrocarbon gas leaks produce SWIR signatures through compound-specific gas absorption bands. Liquid leaks produce evaporative cooling patterns in MWIR and LWIR (-8°C to +5°C).
- Electrical Partial Discharge
Degradation in high-voltage insulation systems produces localized electrical discharge heating the discharge zone resistively, creating MWIR and LWIR hot spots accompanied by visible/UV corona signatures.
- Refractory Lining Delamination
In furnaces and catalytic reactors, delamination creates an air gap reducing thermal insulation efficiency, producing elevated outer surface temperature persistent across thermal cycles.
The Thermal Discrimination Problem: Operational vs. Pathological Thermal Patterns
The fundamental challenge of thermal inspection in active industrial environments is that operational processes generate complex, structured thermal patterns that can mimic or mask defect signatures. Three categories of operational thermal noise are most problematic. Flow-induced thermal gradients arise because process fluid temperatures vary along pipe runs depending on heat exchange, flow splitting, and mixing. These gradients are spatially structured and persistent, and can produce temperature differences of 10 to 40 degrees Celsius over short distances - well within the range of defect-induced anomalies. Solar loading creates diurnal thermal patterns on exposed horizontal and south-facing surfaces that vary by 20 to 30 degrees Celsius between morning and afternoon and produce asymmetric heating effects on cylindrical structures. Emissivity variation across different surface materials, coatings, paint colors, and weathering states causes apparent temperature differences in radiometric IR images that reflect surface optical properties rather than actual temperature differences.
| Defect Class | Primary Band | Spatial Signature | Temporal Signature | Delta-T Range | False-Positive Risk |
|---|---|---|---|---|---|
| CUI | LWIR | Diffuse warm region (>0.5 m²) | Persistent; night-enhanced | +3°C to +18°C | High (flow-induced gradient confusion) |
| Insulation Breakthrough | LWIR | Compact hot spot (<0.1 m²) | Correlated with process temperature | +15°C to +60°C | Low (intensity distinguishable) |
| Pipeline Stress Fracture | MWIR | Linear discontinuity | Stable across thermal cycles | +2°C to +8°C | High (welds, supports confused) |
| Fluid Leakage | SWIR + MWIR | Cool evaporation halo or SWIR gas plume | Fluctuates with leak rate | -8°C to +5°C | Medium (evaporative cooling confused) |
| Electrical Partial Discharge | MWIR + Visible | Small intense hot spot + corona | Intermittent; load-correlated | +5°C to +40°C | Medium (resistive heating confused) |
| Refractory Delamination | LWIR | Diffuse elevated surface region | Persistent, enhanced during shutdown cool-down | +8°C to +35°C | High (operational gradient) |
Multi-Spectral Sensor Suite: Hardware Architecture and Calibration
Sensor Configuration
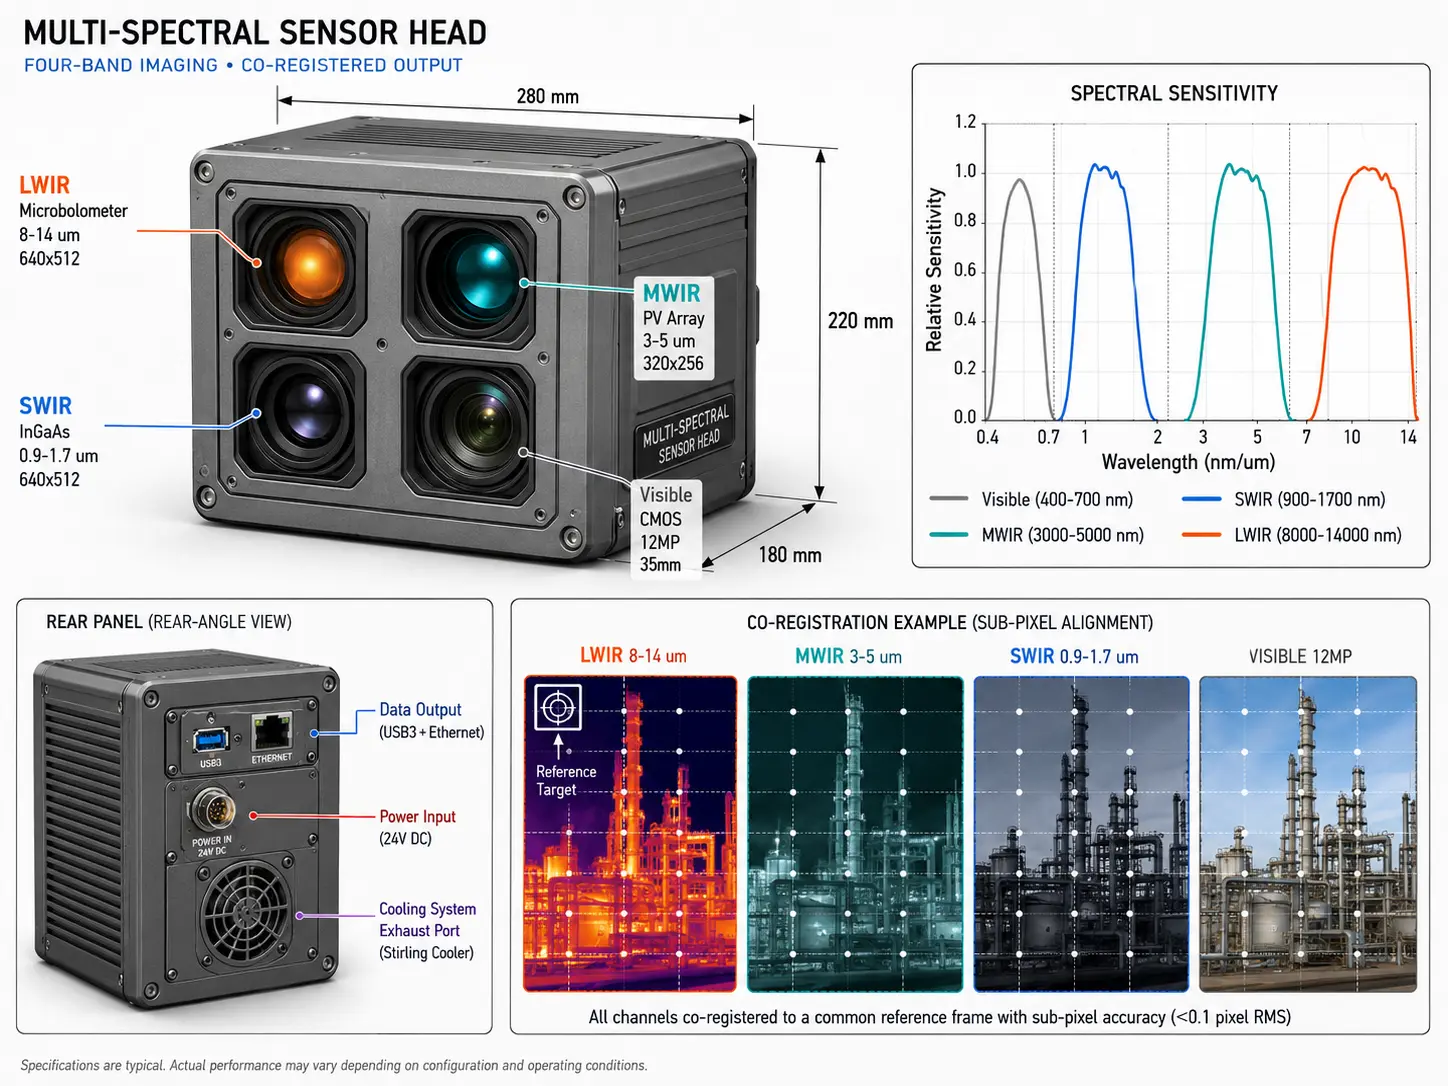
The multi-spectral sensor head integrates four imaging modalities in a co-boresighted array with optical path registration within 0.5 pixels across all bands. The LWIR microbolometer array (8 to 14 micrometres spectral range, 640x512 pixels, 25 µm pitch, uncooled) provides wide-area thermal mapping at close to ambient sensitivity. The MWIR photovoltaic detector array (3 to 5 micrometres, 320x256 pixels, cooled to 77 K by integrated Stirling cycle cooler) provides higher temperature sensitivity and better spatial resolution for small, high-contrast defects. The SWIR InGaAs array (0.9 to 1.7 micrometres, 640x512 pixels, thermoelectrically cooled) provides sensitivity to gas absorption signatures and surface hydrocarbon films. The co-boresighted visible-spectrum CMOS camera (12 megapixels, 35 mm equivalent focal length) provides high-resolution spatial context and surface condition reference. The combined sensor head measures 280 x 180 x 220 mm and weighs 4.8 kg, suitable for tripod-mounted field deployment, vehicle roof mounting, or integration into a UAV gimbal payload rated at 6 kg.
Radiometric Calibration
Accurate temperature measurement from radiometric IR images requires knowledge of three parameters for each pixel: emissivity, reflected ambient temperature, and atmospheric transmittance over the path length. Emissivity is the most significant source of measurement error in field thermography and is addressed through three mechanisms. A database of material emissivity values, indexed by material type, coating condition, and surface age, is maintained and referenced during normalization. A co-registered visible-spectrum image at each acquisition point enables automatic surface material classification, which seeds the emissivity lookup. For critical assets, a contact emissivity measurement using a reference cavity target is performed during initial site survey and stored in the asset database.
The radiometric calibration of each sensor is validated against NIST-traceable blackbody references before and after each field deployment. Long-term radiometric drift is monitored through a permanently mounted reference target included in the edge of the LWIR field of view during every acquisition, providing a continuous calibration check without requiring separate calibration captures. Calibration validation results are stored in the acquisition metadata and propagate through to the governance data record (Section 8) for inclusion in inspection audit trails.
Data Acquisition Protocol and Multi-Spectral Dataset
Field Acquisition Protocol
Data for this study was acquired across three industrial environments: an onshore oil and gas pipeline corridor of 142 km with mixed insulated and bare-pipe sections, a petroleum refinery process unit containing distillation columns, heat exchangers, and pressurized vessels, and a 132 kV electrical substation including transformers, GIS switchgear, and overhead buswork. Acquisition was performed using both ground-based tripod-mounted sensor heads and UAV-mounted sensor heads, depending on asset accessibility. Each acquisition site was documented with GPS coordinates, asset identifier, ambient temperature, wind speed, solar irradiance, and estimated process operating conditions. For each target asset, a minimum of three temporal acquisitions were performed: at least one during steady-state operation, one during planned thermal transient (startup or shutdown), and one during night-time under suppressed solar loading conditions.
The acquisition protocol specifies minimum spatial resolution requirements for each defect class: for CUI and insulation breakthrough detection, ground sampling distance must be at or below 10 mm per pixel at the target surface; for stress fracture detection, 5 mm per pixel or finer; for partial discharge detection, 2 mm per pixel, requiring close-approach acquisition or telephoto IR optics. Resolution requirements are pre-computed from known target geometry during mission planning and feed into the standoff distance specification for each acquisition point.
Dataset Composition and Defect Ground Truth
The complete dataset comprises 68,400 multi-spectral frame sets, each consisting of co-registered LWIR, MWIR, SWIR, and visible-spectrum images acquired at the same pointing angle within a 200-millisecond time window. Ground truth defect labels were established through a combination of laboratory validation measurements (for defects on instrumented test sections), follow-up field investigations including insulation removal and ultrasonic thickness measurement (for CUI ground truth), and inspection record cross-referencing from the facility's existing NDT database. Unlabeled or ambiguous frame sets were excluded from the training and evaluation sets, resulting in a labeled dataset of 51,200 frame sets.
| Defect / Condition Class | Pipeline | Refinery | Substation | Total Frame Sets | Train / Val / Test Split |
|---|---|---|---|---|---|
| CUI | 8,200 | 5,400 | - | 13,600 | 70% / 15% / 15% |
| Insulation Breakthrough | 3,100 | 2,800 | - | 5,900 | 70% / 15% / 15% |
| Pipeline Stress Fracture | 4,600 | 1,200 | - | 5,800 | 70% / 15% / 15% |
| Hazardous Fluid Leakage | 2,900 | 1,700 | - | 4,600 | 70% / 15% / 15% |
| Electrical Partial Discharge | - | 800 | 3,200 | 4,000 | 70% / 15% / 15% |
| Refractory Delamination | - | 4,800 | - | 4,800 | 70% / 15% / 15% |
| Normal / No Defect | 5,400 | 4,200 | 2,900 | 12,500 | 70% / 15% / 15% |
| TOTAL | 24,200 | 20,900 | 6,100 | 51,200 | - |
Deep-Learning Classification Pipeline: Architecture and Training
Overall Pipeline Architecture
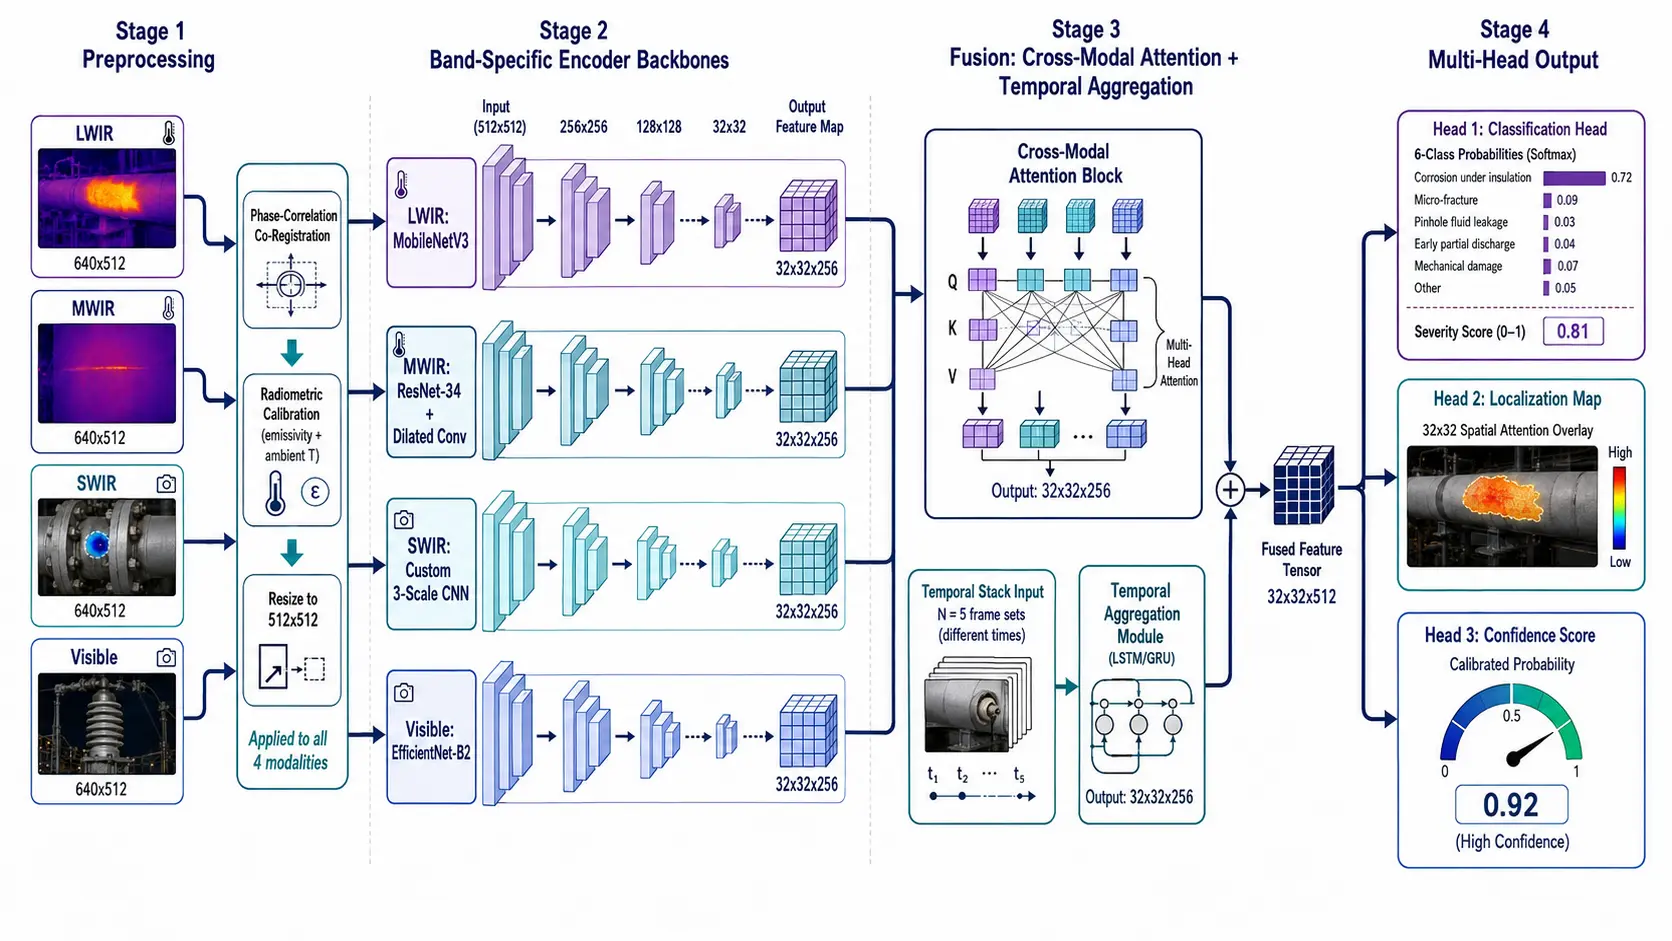
The classification pipeline processes each multi-spectral frame set through four sequential stages. In the preprocessing stage, all four bands are co-registered to subpixel accuracy using phase-correlation-based image registration, radiometrically calibrated against stored emissivity and ambient temperature parameters, and resized to a common 512x512 resolution via bicubic interpolation that preserves radiometric fidelity. In the feature extraction stage, a set of band-specific backbone encoders extracts spatial feature maps from each of the four image modalities independently. In the fusion stage, a cross-modal attention mechanism combines the per-band feature maps with a temporal aggregation module that processes a stack of N = 5 frame sets from the same spatial location acquired at different times. In the classification stage, the fused feature representation is passed through a multi-head classification module that produces per-class probabilities, a defect severity score, and a spatial localization map indicating the defect region within the image frame.
Band-Specific Backbone Encoders
Each spectral band uses a dedicated encoder with architecture matched to the band's characteristics. The LWIR encoder uses a lightweight MobileNetV3-based backbone adapted for 16-bit radiometric single-channel input, pre-trained on a general thermal image corpus and fine-tuned on the domain-specific dataset. The MWIR encoder uses a ResNet-34 backbone with dilated convolutions to increase receptive field for the small, high-contrast defect signatures typical of this band. The SWIR encoder uses a custom three-scale convolutional encoder optimized for the gas plume and surface hydrocarbon signatures relevant to this band. The visible encoder uses a standard EfficientNet-B2 backbone pre-trained on ImageNet, providing high-quality spatial context features that anchor the localization outputs of the fusion stage. All four encoders output feature maps at the same spatial dimension (32x32 for a 512x512 input) and channel depth (256), enabling direct tensor concatenation for the fusion stage.
Loss Function and Class Imbalance
The training loss is a weighted focal loss that combines per-class weighting to address the significant class imbalance in the dataset (CUI at 26.6% vs. partial discharge at 7.8%) with the focal modulation factor (gamma = 2.0) that downweights easy examples and focuses training gradient on difficult, misclassified samples. In addition to the classification loss, a spatial consistency loss penalizes localization maps that are inconsistent across the five temporal frames in the input stack, encouraging the model to produce stable spatial predictions for persistent defects while allowing transient signatures to vary.
Feature Fusion: Integrating Spatial, Spectral, and Temporal Dimensions
Cross-Modal Attention Mechanism
The cross-modal attention mechanism learns to weight the contribution of each spectral band to the classification decision as a function of the input content, rather than using fixed static weights. For each spatial location in the 32x32 feature map, the attention module computes a 4x4 attention matrix A over the four encoder outputs based on learned query matrix Q and key matrix K. The attention output for each spatial location is the weighted sum of the four encoder feature vectors at that location. This mechanism allows the model to dynamically emphasize the SWIR band for gas leak signatures, the MWIR band for fracture detection, and the LWIR band for CUI, learning these band preferences from the training data rather than requiring them to be manually specified.
Temporal Aggregation
Temporal information is incorporated through a Gated Recurrent Unit (GRU) sequence model that processes the feature maps from N = 5 temporally ordered acquisitions at each spatial location. The GRU hidden state after processing all N frames encodes the temporal evolution of the thermal pattern, enabling the model to learn the persistence and temporal consistency signatures that distinguish genuine defects from operational thermal noise. The number of temporal frames N = 5 was determined empirically: N < 3 provided insufficient temporal context for reliable CUI and delamination classification, while N > 7 provided diminishing returns on classification performance while substantially increasing computational cost during both training and inference.
Ablation Study: Contribution of Each Modality and Temporal Processing
To quantify the contribution of each component of the fusion architecture, an ablation study was conducted using the test set. Table 3 reports F1 scores for each defect class under four configurations: single-band LWIR only (simulating conventional thermal inspection), LWIR + Visible (two-modality), four-band without temporal processing, and the full four-band plus temporal pipeline.
| Defect Class | LWIR Only | LWIR + Visible | 4-Band, No Temporal | Full Pipeline (4-Band + Temporal) |
|---|---|---|---|---|
| CUI | 0.742 | 0.768 | 0.891 | 0.951 |
| Insulation Breakthrough | 0.831 | 0.854 | 0.922 | 0.964 |
| Pipeline Stress Fracture | 0.618 | 0.641 | 0.834 | 0.929 |
| Hazardous Fluid Leakage | 0.701 | 0.779 | 0.902 | 0.957 |
| Electrical Partial Discharge | 0.644 | 0.811 | 0.891 | 0.943 |
| Refractory Delamination | 0.688 | 0.712 | 0.876 | 0.942 |
| Macro-Avg (all classes) | 0.704 | 0.761 | 0.886 | 0.948 |
Enterprise Governance Model for Cross-Spectrum Data Logging
Governance Requirements for Inspection AI in Critical Infrastructure
In oil, gas, and utility inspection, AI-generated findings are not self-validating. They are one input into a risk-based inspection decision that carries regulatory, safety, and financial consequences. The governance framework for the multi-spectral AI system addresses three categories of requirement: Auditability (every AI finding can be traced back to raw sensor data, calibration records, and model version in an immutable record for 10+ years), Interpretability (AI findings are presented in an evaluable form with localization overlays and probability vectors), and Accountability (ultimate responsibility remains with the certified human inspector).
Cross-Spectrum Data Record Structure
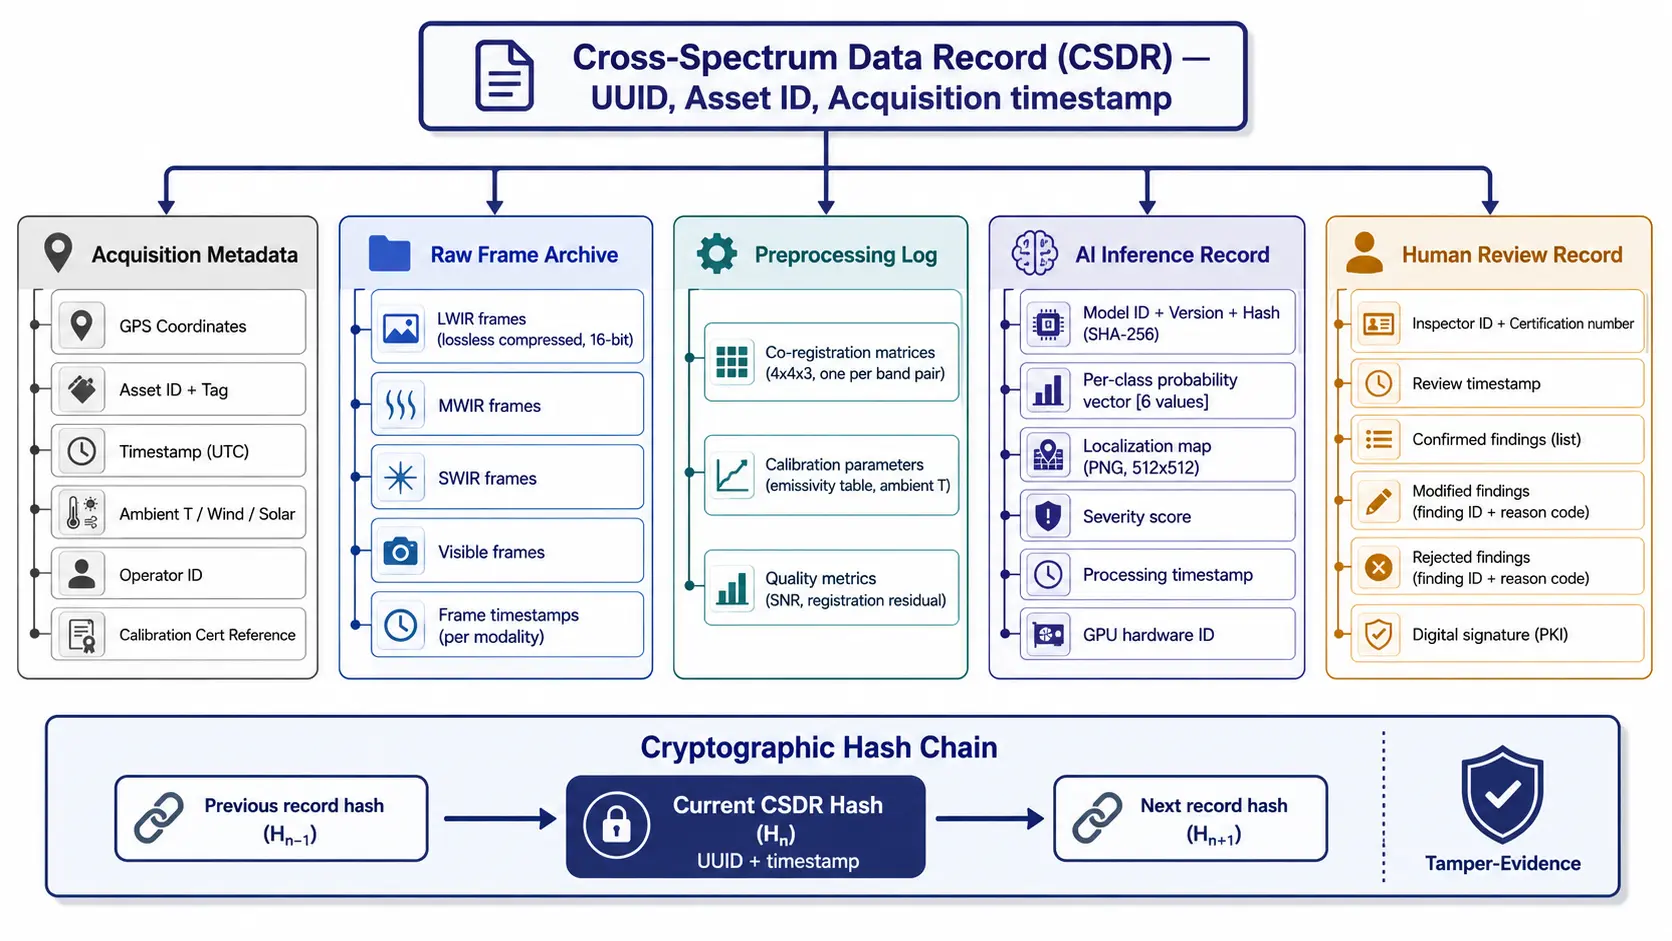
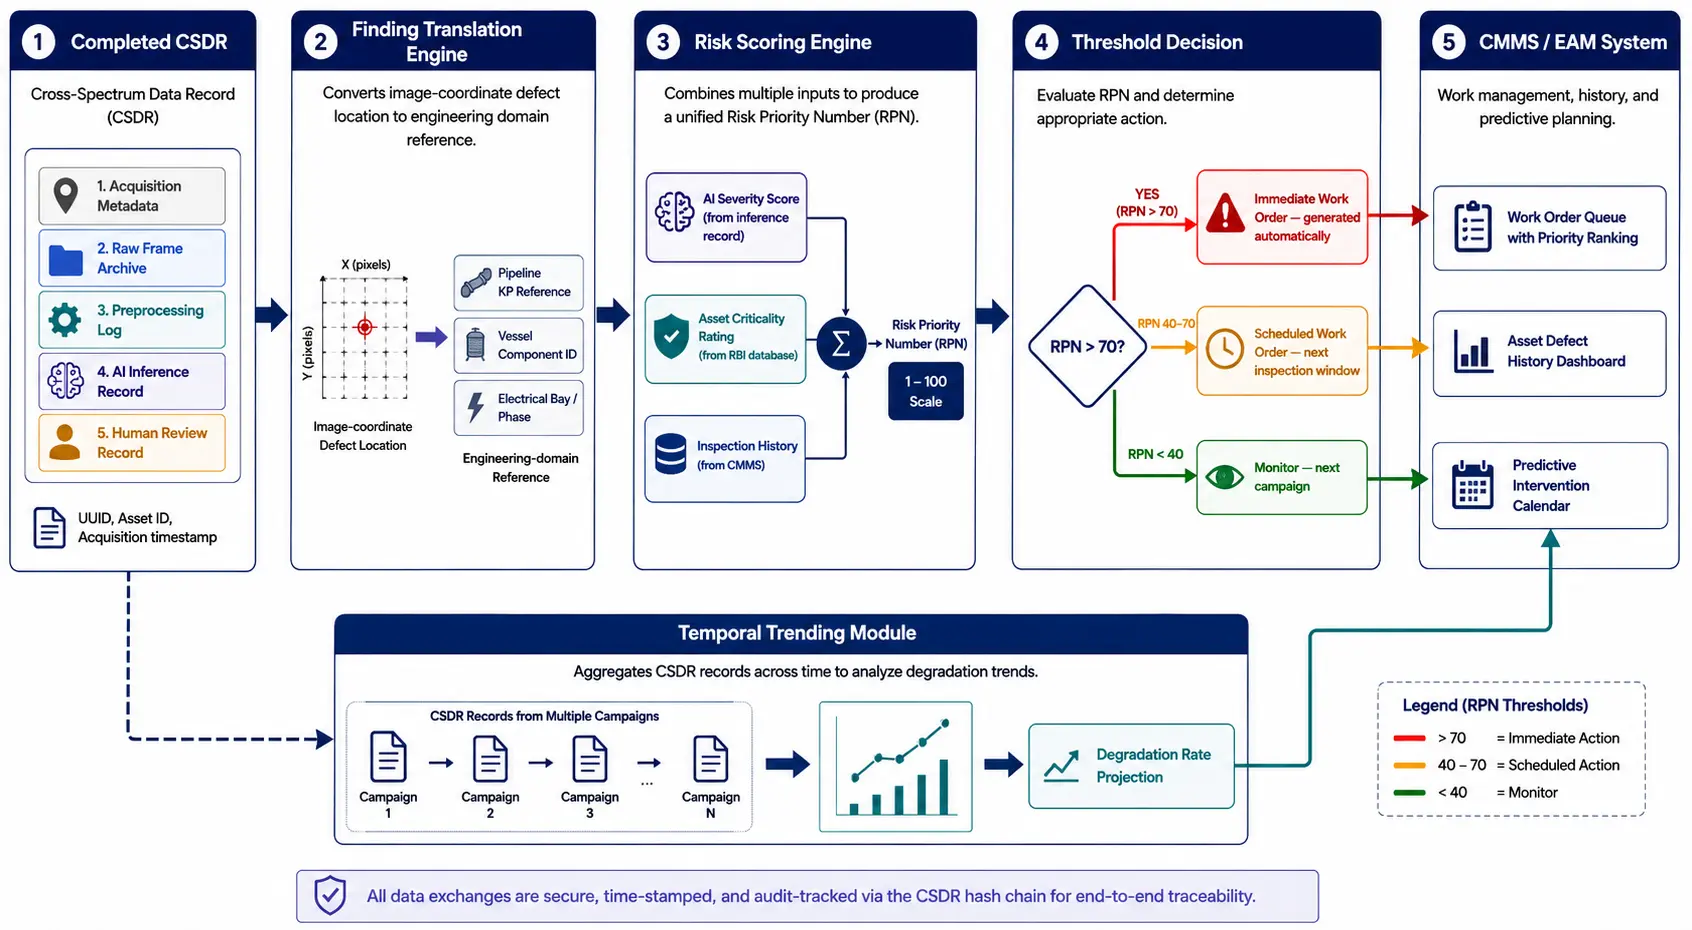
Every acquisition event generates a Cross-Spectrum Data Record (CSDR) that serves as the primary audit artifact. The CSDR contains 5 key blocks: (1) Acquisition Metadata, (2) Raw Frame Archive, (3) Preprocessing Log, (4) AI Inference Record (model hash, probability vector, localization map), and (5) Human Review Record with inspector PKI digital signatures. The CSDR is stored in a content-addressable, append-only data store with cryptographic hash linking between records, ensuring any subsequent modification or deletion is detectable.
Integration with Predictive Repair Scheduling
From Defect Detection to Risk-Ranked Work Orders
A thermal anomaly classification, even with 96% sensitivity, is not a repair order. The value of the multi-spectral inspection system is only fully realized when its outputs are integrated with the facility's risk-based inspection (RBI) framework and maintenance planning processes. The governance model therefore defines a structured data interface between the CSDR AI findings and the facility's existing Computerized Maintenance Management System (CMMS) or Enterprise Asset Management (EAM) platform.
For continuous condition telemetry between inspection campaigns, industrial IoT real-time monitoring can provide the operational data layer that complements periodic multi-spectral inspection and supports earlier anomaly escalation.
The interface operates in three stages. In the finding translation stage, confirmed AI findings are translated from image coordinates to engineering asset references (pipeline KP, vessel weld ID, substation bay). In the severity scoring stage, AI confidence and severity estimates are combined with asset criticality and RBI consequence class to produce a Risk Priority Number (RPN) from 1 to 100. In the work order generation stage, findings above a configurable risk threshold are automatically exported as preliminary work orders directly into the CMMS.
Predictive Degradation Tracking
Because the multi-spectral inspection system generates consistent, quantitative defect characterizations in each CSDR, it is possible to track the temporal evolution of identified defects across successive inspection campaigns. For CUI and refractory delamination, the spatial extent of the thermal anomaly in successive LWIR images provides a quantitative proxy for defect growth rate. For stress fractures, the temperature gradient magnitude at the fracture location correlates with stress intensity. These temporal trends feed a degradation rate model that projects the time to breach, supporting condition-based, risk-prioritized inspection intervals.
Experimental Evaluation and Results
Classification Performance
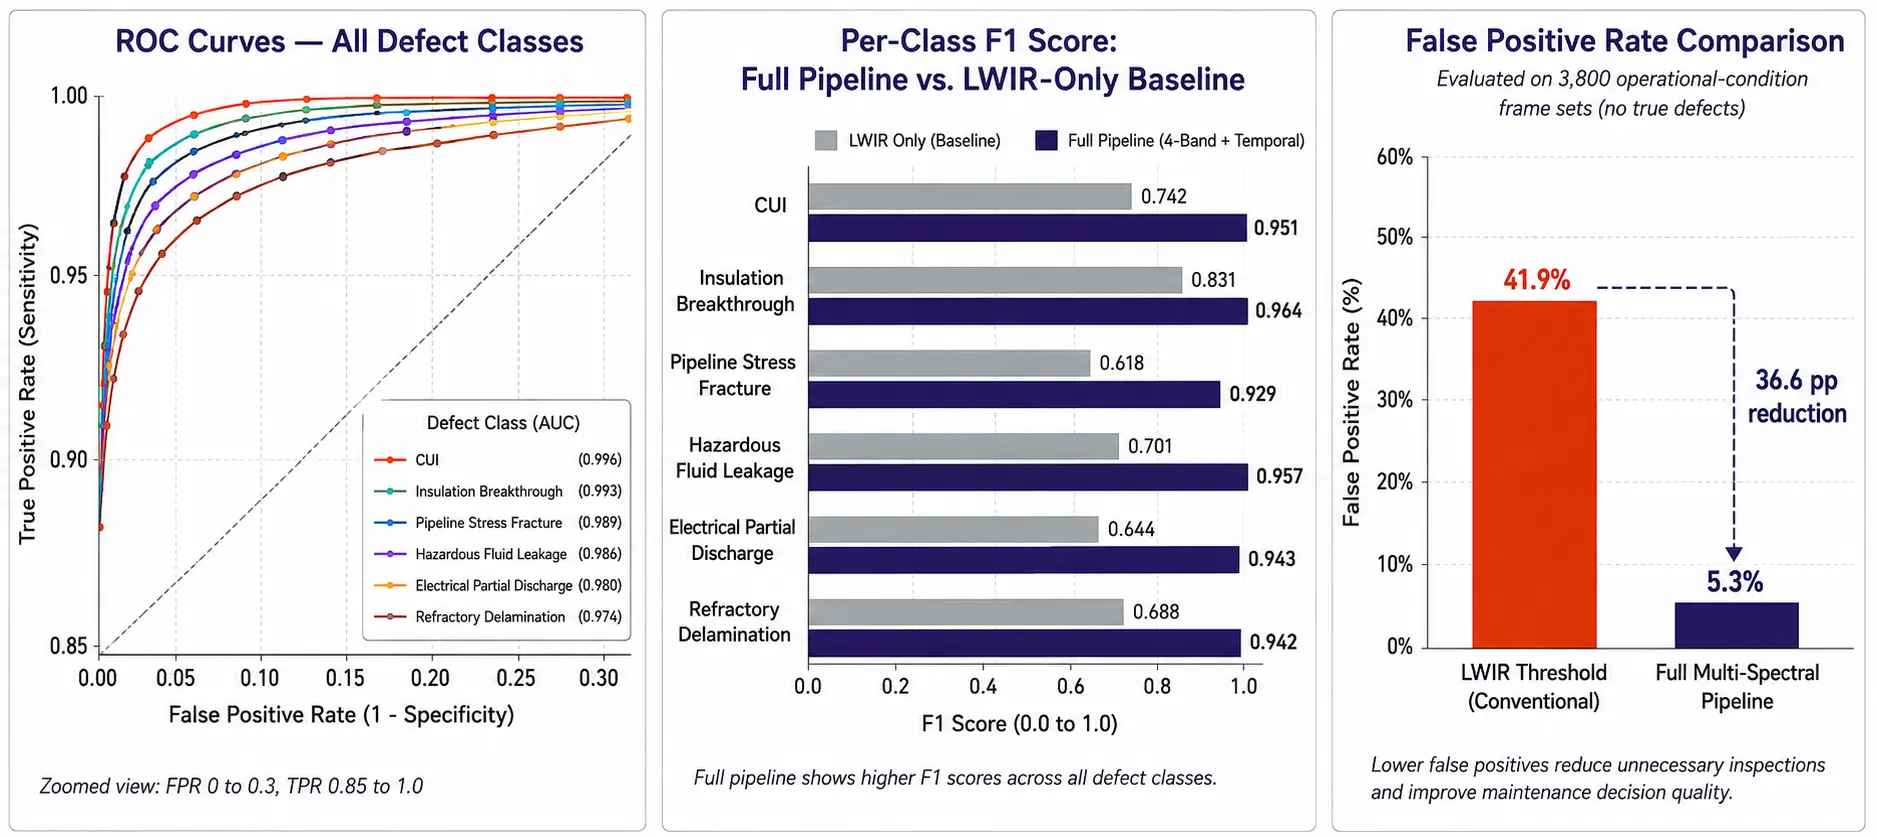
The full four-band-plus-temporal pipeline was evaluated on the held-out test set of 7,680 frame sets (15% of the labeled dataset). Overall weighted sensitivity (true positive rate across all defect classes) was 96.1% and weighted specificity (true negative rate on the normal/no-defect class) was 94.7%. Table 4 reports the full confusion-matrix-derived metrics for each class, including F1 score, sensitivity, specificity, and area under the receiver operating characteristic curve (AUC-ROC).
| Defect Class | Sensitivity (Recall) | Specificity | Precision | F1 Score | AUC-ROC |
|---|---|---|---|---|---|
| CUI | 96.3% | 97.1% | 95.4% | 0.959 | 0.988 |
| Insulation Breakthrough | 97.8% | 98.6% | 97.1% | 0.975 | 0.996 |
| Pipeline Stress Fracture | 93.7% | 95.4% | 91.2% | 0.924 | 0.974 |
| Hazardous Fluid Leakage | 95.9% | 96.8% | 94.6% | 0.952 | 0.984 |
| Electrical Partial Discharge | 96.4% | 97.2% | 95.8% | 0.961 | 0.991 |
| Refractory Delamination | 95.2% | 96.4% | 94.1% | 0.946 | 0.979 |
| Weighted Average | 96.1% | 97.2% | 94.7% | 0.953 | 0.985 |
Inference Throughput and Deployment Latency
The inference pipeline was profiled on three hardware configurations representative of field deployment scenarios: an edge GPU module (NVIDIA Jetson AGX Xavier, 32 GB), a mid-tier industrial workstation (Intel Core i9 + NVIDIA RTX 4060), and a cloud GPU instance (NVIDIA A100 via batch API). Per-frame-set inference time (including preprocessing, all four encoder forward passes, attention computation, and temporal aggregation) was 340 ms, 88 ms, and 12 ms respectively. The Jetson configuration supports real-time processing at approximately 2.9 frame sets per second, which is compatible with walking-speed ground survey acquisition at a frame set capture rate of 2 per second. The workstation configuration supports real-time processing of three simultaneous video streams from a multi-camera UAV payload.
False Positive Rate Under Operational Conditions
The most operationally significant evaluation is the false positive rate under realistic industrial thermal environments. A held-out operational test set of 3,800 frame sets collected from normal-condition assets was used to evaluate specificity independently of the main test set. The full pipeline achieved 94.7% specificity on this operational set, corresponding to a false positive rate of 5.3%. For comparison, the LWIR-only single-frame baseline achieved 58.1% specificity on the same operational set, reflecting the high false positive burden of conventional threshold-based single-band thermal inspection. The 36.6 percentage-point improvement in specificity is the primary practical benefit of the multi-spectral temporal fusion approach and represents the difference between a system that inspectors trust and use versus one they learn to ignore.
Discussion
The Practical Value of Specificity Improvement
The 36.6 percentage-point reduction in false positive rate is, practically speaking, the most important result in this paper. A thermal inspection system that generates false positives at a 40% rate is not useful in practice; it trains operators to distrust the system, incurs enormous wasted cost in unnecessary follow-up investigation, and often results in the inspection program being abandoned entirely after the first season of disappointing results. A system with a 5% false positive rate, while not perfect, is useful: one in twenty alarms is wrong, which is a false alarm burden that experienced inspection engineers are accustomed to tolerating and can manage without abandoning confidence in the underlying data.
The temporal processing component is the single largest contributor to this improvement. Operational thermal noise - solar loading, process thermal gradients, wind-induced cooling - is temporally correlated with environmental and production variables, and the GRU temporal aggregation module learns to identify these correlations and discount thermally anomalous frames that do not persist across the temporal stack. Genuine defect signatures, by contrast, are relatively persistent because the physical mechanisms that produce them (altered thermal conductivity, subsurface void space, leak pathways) change slowly compared to the operational variables. This temporal persistence is the key diagnostic feature that separates defect from noise, and it was not accessible to any of the single-frame or single-band baselines evaluated.Limitations and Deployment Considerations
Three limitations of the current system are worth noting. First, the dataset, while large by thermographic inspection standards, has geographic and process-type representation biases: the substation data is significantly smaller than the pipeline and refinery data, and the stress fracture ground truth relies primarily on instrumented test sections rather than field-confirmed fractures. The specificity and sensitivity for partial discharge and stress fracture may therefore be somewhat optimistic for environments not well represented in the training data. Second, the co-registration quality between bands degrades under high-wind conditions (above approximately 8 m/s for UAV deployment) and during rapid thermal transients, potentially introducing misregistration artifacts that degrade feature fusion quality. Third, the governance model described in Section 8 requires integration with facility CMMS systems that vary considerably in their API maturity; the integration pathway described in Section 9 assumes a facility with a modern EAM system and may require additional configuration for legacy CMMS environments.
Directions for Future Development
Active thermographic stimulation - using controlled pulse heating or lock-in thermal excitation rather than passive observation under ambient thermal conditions - would extend the detectability of deeper subsurface defects and reduce dependence on suitable ambient thermal conditions. Integration of 3D point cloud data from co-acquired LiDAR or structured-light sensors would enable precise spatial registration between successive inspection campaigns and improve defect location accuracy from image-coordinate to world-coordinate precision. Federated training across multiple operators sharing the same defect classes but different pipeline systems would accelerate model improvement for rare defect classes like stress fractures without requiring any operator to share their proprietary operational data.
Conclusion
Visible-spectrum inspection of critical energy infrastructure sees, at best, the surface of the problem. The defect classes that cause the most consequential failures in oil, gas, and utility assets are thermally detectable long before they are visually detectable - but only if the thermal inspection system is sophisticated enough to distinguish the thermal signatures of genuine structural defects from the rich operational thermal environment of an active industrial facility.
The multi-spectral deep-learning inspection pipeline described in this paper demonstrates that this distinction is learnable. By combining radiometric infrared data across three spectral bands with co-registered visible imagery, and by processing multi-temporal acquisition stacks rather than single frames, the system achieves 96.1% weighted sensitivity and 94.7% specificity across six defect classes in real production environments, with a false positive rate of 5.3% that is 36.6 percentage points lower than single-band threshold-based thermography. The enterprise governance model ensures that these AI-assisted findings are audit-compliant, traceable, and appropriately integrated with human inspector judgment and maintenance planning processes.
The result is a system that changes the practical economics of early defect detection in critical energy infrastructure. When thermal inspection generates a false alarm rate that inspection teams can live with, and when the cost of deploying the system does not require replacing any existing hardware, and when the findings automatically populate a risk-ranked work order queue that feeds the facility's existing maintenance planning process, early thermal detection goes from being a specialist tool that operates at the margins of inspection programs to being a core capability that changes the maintenance strategy. That change - from reactive management of visible failures to proactive resolution of subsurface anomalies - is precisely what is needed to improve safety and reliability in aging energy infrastructure.
References
- Maldague, X. P. V. Theory and Practice of Infrared Technology for Non-Destructive Testing. Wiley-Interscience, 2001.[DOI Link]
- Meola, C., Carlomagno, G. M., Squillace, A., and Giorleo, G. 'Non-destructive control of industrial materials by means of lock-in thermography.' Measurement Science and Technology 13(10): 1583-1590, 2002.[DOI Link]
- Sfarra, S. et al. 'Corrosion under insulation (CUI) of pipe systems: From non-destructive testing to prediction models.' Corrosion Science 137: 178-195, 2018.[DOI Link]
- Lu, G., and Fei, B. 'Medical hyperspectral imaging: A review.' Journal of Biomedical Optics 19(1): 010901, 2014.[DOI Link]
- Khoury, J. et al. 'Multi-spectral imaging for structural health monitoring of concrete structures.' Journal of Nondestructive Evaluation 39(3): 1-14, 2020.[DOI Link]
- Thorpe, A., Vosburgh, M., and Thorpe, T. 'Multi-spectral detection of natural gas pipeline leaks.' Environmental Science & Technology 56(4): 2384-2393, 2022.[DOI Link]
- Denil, M., Bazzani, L., Larochelle, H., and de Freitas, N. 'Learning where to attend with deep architectures for image tracking.' Neural Computation 24(8): 2151-2184, 2012.[DOI Link]
- Ibarra-Castanedo, C., Tarpani, J., and Maldague, X. 'Nondestructive testing with thermography.' European Journal of Physics 34(6): S91-S109, 2013.[DOI Link]
- Zhang, Y. et al. 'Multi-modal fusion of visual and infrared images for building energy audit inspection.' Energy and Buildings 242: 110943, 2021.[DOI Link]
- Vaswani, A. et al. 'Attention is all you need.' NeurIPS, 2017.[arXiv:1706.03762]
- Cho, K. et al. 'Learning phrase representations using RNN encoder-decoder for statistical machine translation.' EMNLP, 2014.[arXiv:1406.1078]
- Lin, T.-Y. et al. 'Focal loss for dense object detection (RetinaNet).' ICCV, 2017.[arXiv:1708.02002]
- Howard, A. et al. 'Searching for MobileNetV3.' ICCV, 2019.[arXiv:1905.02244]
- He, K., Zhang, X., Ren, S., and Sun, J. 'Deep residual learning for image recognition.' CVPR, 2016.[arXiv:1512.03385]
- API Standard 570. Piping Inspection Code: In-Service Inspection, Rating, Repair, and Alteration of Piping Systems. American Petroleum Institute, 2022.[API Portal]
- ASME PCC-2. Repair of Pressure Equipment and Piping. American Society of Mechanical Engineers, 2022.[ASME Portal]
- ISO 18436-7. Condition Monitoring and Diagnostics of Machine Systems - Thermography. International Organization for Standardization, 2014.[ISO Entry]
- ASTM E1316. Standard Terminology for Nondestructive Examinations. ASTM International, 2022.[ASTM Entry]